Russian vs Alaska Native Single Mother Households
COMPARE
Russian
Alaska Native
Single Mother Households
Single Mother Households Comparison
Russians
Alaska Natives
5.3%
SINGLE MOTHER HOUSEHOLDS
99.7/ 100
METRIC RATING
28th/ 347
METRIC RANK
7.4%
SINGLE MOTHER HOUSEHOLDS
0.2/ 100
METRIC RATING
257th/ 347
METRIC RANK
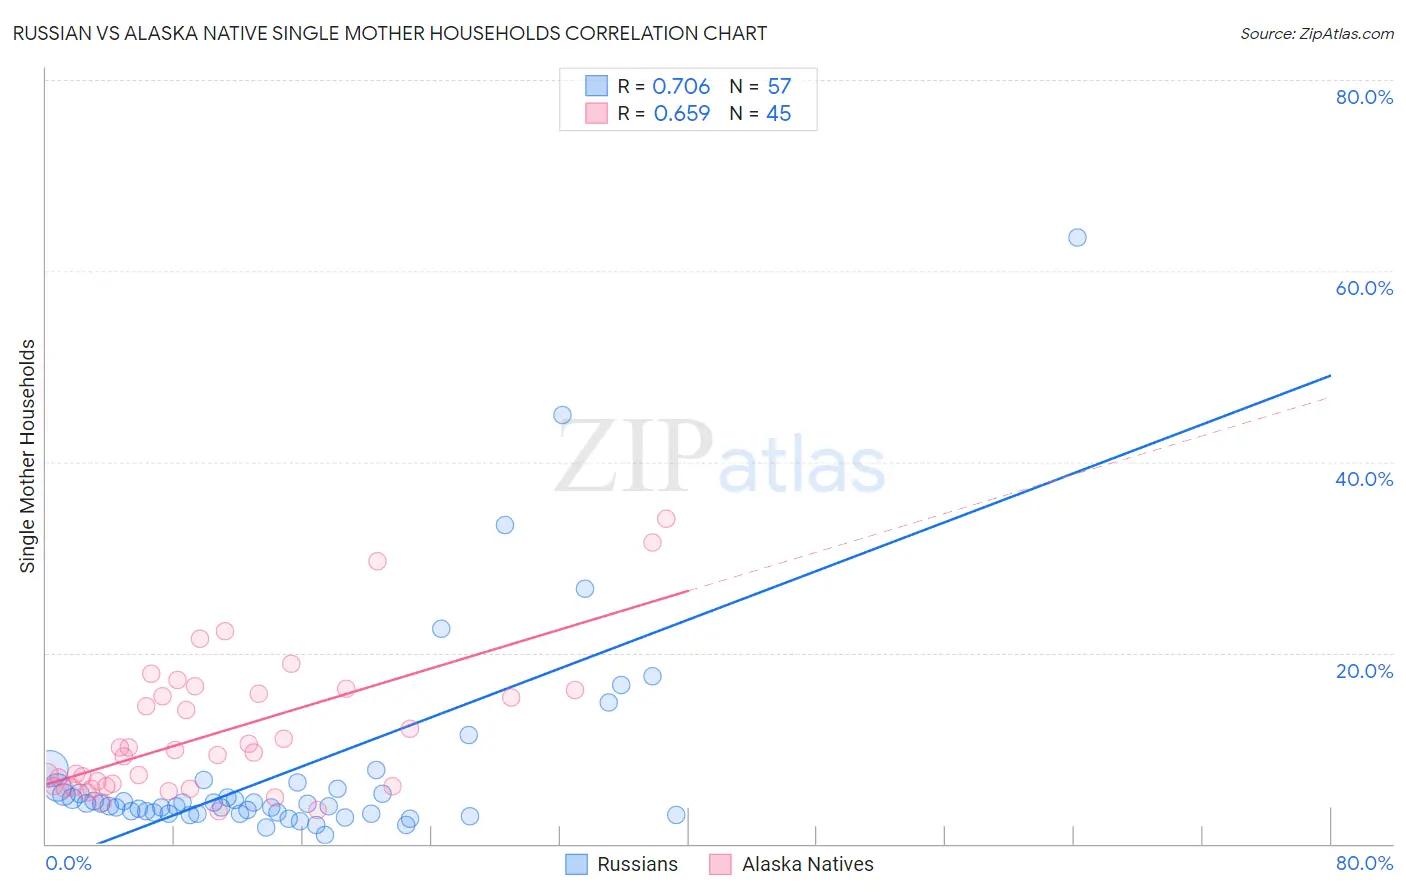
Russian vs Alaska Native Single Mother Households Correlation Chart
The statistical analysis conducted on geographies consisting of 509,106,631 people shows a strong positive correlation between the proportion of Russians and percentage of single mother households in the United States with a correlation coefficient (R) of 0.706 and weighted average of 5.3%. Similarly, the statistical analysis conducted on geographies consisting of 76,685,666 people shows a significant positive correlation between the proportion of Alaska Natives and percentage of single mother households in the United States with a correlation coefficient (R) of 0.659 and weighted average of 7.4%, a difference of 40.0%.
Single Mother Households Correlation Summary
| Measurement | Russian | Alaska Native |
| Minimum | 0.89% | 3.4% |
| Maximum | 63.5% | 34.0% |
| Range | 62.6% | 30.6% |
| Mean | 7.8% | 11.7% |
| Median | 4.2% | 9.6% |
| Interquartile 25% (IQ1) | 3.2% | 6.0% |
| Interquartile 75% (IQ3) | 5.8% | 15.9% |
| Interquartile Range (IQR) | 2.6% | 9.9% |
| Standard Deviation (Sample) | 11.0% | 7.4% |
| Standard Deviation (Population) | 10.9% | 7.3% |
Similar Demographics by Single Mother Households
Demographics Similar to Russians by Single Mother Households
In terms of single mother households, the demographic groups most similar to Russians are Latvian (5.3%, a difference of 0.010%), Burmese (5.3%, a difference of 0.080%), Immigrants from Korea (5.3%, a difference of 0.080%), Cambodian (5.3%, a difference of 0.090%), and Bhutanese (5.3%, a difference of 0.10%).
| Demographics | Rating | Rank | Single Mother Households |
| Eastern Europeans | 99.8 /100 | #21 | Exceptional 5.2% |
| Thais | 99.8 /100 | #22 | Exceptional 5.2% |
| Immigrants | Austria | 99.8 /100 | #23 | Exceptional 5.2% |
| Armenians | 99.8 /100 | #24 | Exceptional 5.2% |
| Immigrants | Japan | 99.8 /100 | #25 | Exceptional 5.2% |
| Immigrants | Lithuania | 99.8 /100 | #26 | Exceptional 5.3% |
| Bhutanese | 99.7 /100 | #27 | Exceptional 5.3% |
| Russians | 99.7 /100 | #28 | Exceptional 5.3% |
| Latvians | 99.7 /100 | #29 | Exceptional 5.3% |
| Burmese | 99.7 /100 | #30 | Exceptional 5.3% |
| Immigrants | Korea | 99.7 /100 | #31 | Exceptional 5.3% |
| Cambodians | 99.7 /100 | #32 | Exceptional 5.3% |
| Immigrants | Switzerland | 99.7 /100 | #33 | Exceptional 5.3% |
| Bulgarians | 99.7 /100 | #34 | Exceptional 5.3% |
| Immigrants | Northern Europe | 99.7 /100 | #35 | Exceptional 5.3% |
Demographics Similar to Alaska Natives by Single Mother Households
In terms of single mother households, the demographic groups most similar to Alaska Natives are Pueblo (7.4%, a difference of 0.020%), Seminole (7.4%, a difference of 0.040%), Immigrants from Yemen (7.4%, a difference of 0.040%), Immigrants from Zaire (7.4%, a difference of 0.080%), and Japanese (7.4%, a difference of 0.10%).
| Demographics | Rating | Rank | Single Mother Households |
| Immigrants | Africa | 0.4 /100 | #250 | Tragic 7.3% |
| Malaysians | 0.3 /100 | #251 | Tragic 7.3% |
| Alaskan Athabascans | 0.3 /100 | #252 | Tragic 7.3% |
| Cajuns | 0.3 /100 | #253 | Tragic 7.3% |
| Immigrants | Ecuador | 0.3 /100 | #254 | Tragic 7.3% |
| Mexican American Indians | 0.2 /100 | #255 | Tragic 7.4% |
| Seminole | 0.2 /100 | #256 | Tragic 7.4% |
| Alaska Natives | 0.2 /100 | #257 | Tragic 7.4% |
| Pueblo | 0.2 /100 | #258 | Tragic 7.4% |
| Immigrants | Yemen | 0.2 /100 | #259 | Tragic 7.4% |
| Immigrants | Zaire | 0.2 /100 | #260 | Tragic 7.4% |
| Japanese | 0.2 /100 | #261 | Tragic 7.4% |
| Immigrants | Somalia | 0.2 /100 | #262 | Tragic 7.4% |
| Immigrants | Nicaragua | 0.2 /100 | #263 | Tragic 7.4% |
| Yaqui | 0.1 /100 | #264 | Tragic 7.4% |