Russian vs U.S. Virgin Islander Single Father Households
COMPARE
Russian
U.S. Virgin Islander
Single Father Households
Single Father Households Comparison
Russians
U.S. Virgin Islanders
2.0%
SINGLE FATHER HOUSEHOLDS
100.0/ 100
METRIC RATING
45th/ 347
METRIC RANK
2.4%
SINGLE FATHER HOUSEHOLDS
31.8/ 100
METRIC RATING
189th/ 347
METRIC RANK
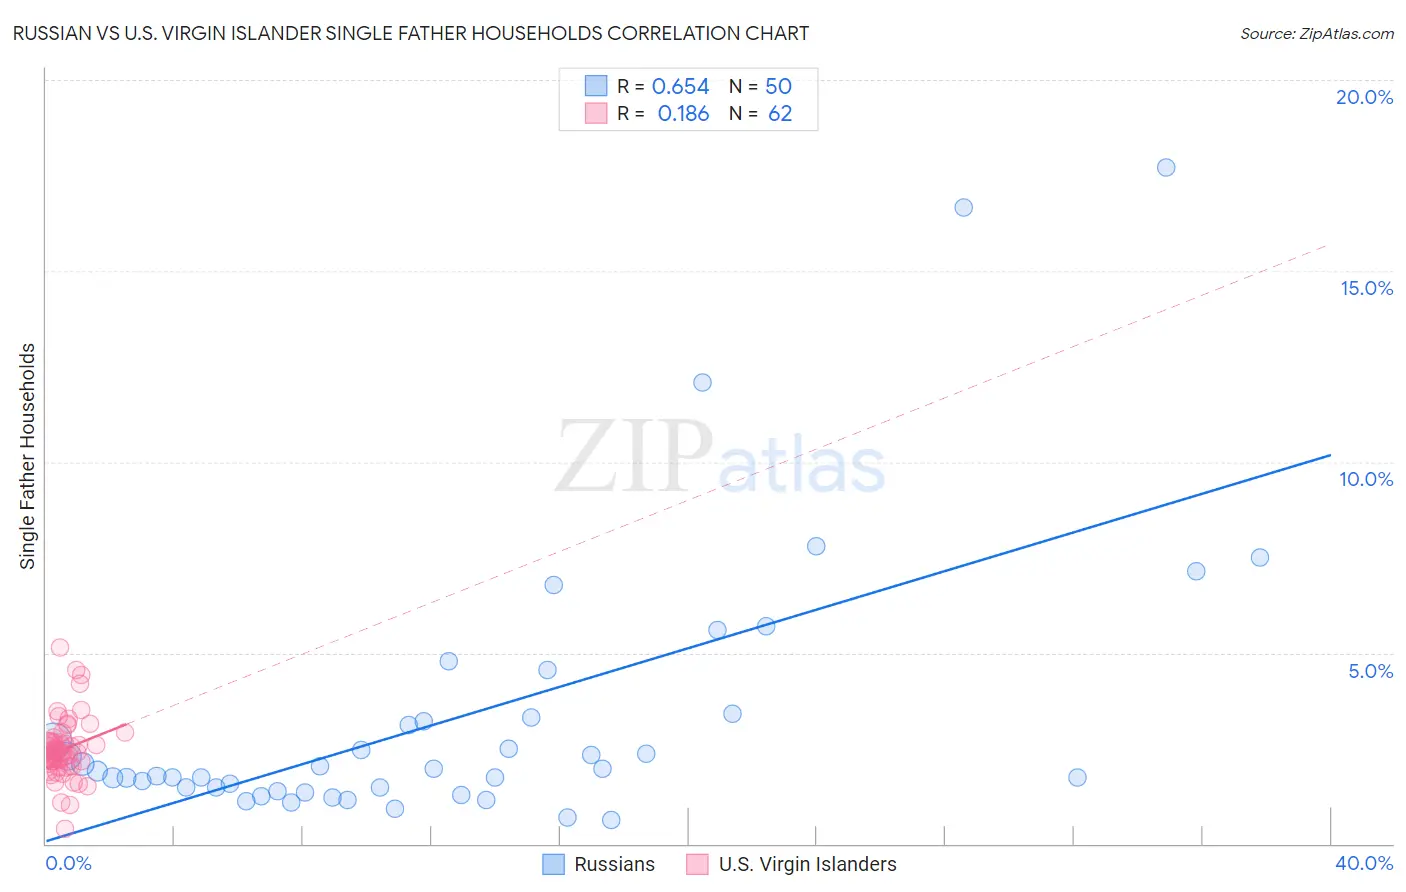
Russian vs U.S. Virgin Islander Single Father Households Correlation Chart
The statistical analysis conducted on geographies consisting of 503,310,659 people shows a significant positive correlation between the proportion of Russians and percentage of single father households in the United States with a correlation coefficient (R) of 0.654 and weighted average of 2.0%. Similarly, the statistical analysis conducted on geographies consisting of 87,373,145 people shows a poor positive correlation between the proportion of U.S. Virgin Islanders and percentage of single father households in the United States with a correlation coefficient (R) of 0.186 and weighted average of 2.4%, a difference of 18.2%.
Single Father Households Correlation Summary
| Measurement | Russian | U.S. Virgin Islander |
| Minimum | 0.62% | 0.38% |
| Maximum | 17.7% | 5.1% |
| Range | 17.1% | 4.7% |
| Mean | 3.3% | 2.5% |
| Median | 1.9% | 2.4% |
| Interquartile 25% (IQ1) | 1.5% | 2.1% |
| Interquartile 75% (IQ3) | 3.3% | 2.7% |
| Interquartile Range (IQR) | 1.8% | 0.57% |
| Standard Deviation (Sample) | 3.6% | 0.80% |
| Standard Deviation (Population) | 3.6% | 0.79% |
Similar Demographics by Single Father Households
Demographics Similar to Russians by Single Father Households
In terms of single father households, the demographic groups most similar to Russians are Latvian (2.0%, a difference of 0.020%), Immigrants from Grenada (2.0%, a difference of 0.10%), Immigrants from Lebanon (2.0%, a difference of 0.10%), Macedonian (2.0%, a difference of 0.33%), and Immigrants from Ukraine (2.0%, a difference of 0.46%).
| Demographics | Rating | Rank | Single Father Households |
| Immigrants | Eastern Europe | 100.0 /100 | #38 | Exceptional 2.0% |
| Immigrants | Sri Lanka | 100.0 /100 | #39 | Exceptional 2.0% |
| Immigrants | Bulgaria | 100.0 /100 | #40 | Exceptional 2.0% |
| Immigrants | Turkey | 100.0 /100 | #41 | Exceptional 2.0% |
| Macedonians | 100.0 /100 | #42 | Exceptional 2.0% |
| Immigrants | Grenada | 100.0 /100 | #43 | Exceptional 2.0% |
| Latvians | 100.0 /100 | #44 | Exceptional 2.0% |
| Russians | 100.0 /100 | #45 | Exceptional 2.0% |
| Immigrants | Lebanon | 100.0 /100 | #46 | Exceptional 2.0% |
| Immigrants | Ukraine | 99.9 /100 | #47 | Exceptional 2.0% |
| Immigrants | Kazakhstan | 99.9 /100 | #48 | Exceptional 2.0% |
| Immigrants | Serbia | 99.9 /100 | #49 | Exceptional 2.0% |
| Immigrants | Switzerland | 99.9 /100 | #50 | Exceptional 2.0% |
| Immigrants | Poland | 99.9 /100 | #51 | Exceptional 2.0% |
| Immigrants | Europe | 99.9 /100 | #52 | Exceptional 2.0% |
Demographics Similar to U.S. Virgin Islanders by Single Father Households
In terms of single father households, the demographic groups most similar to U.S. Virgin Islanders are French (2.4%, a difference of 0.0%), Hmong (2.4%, a difference of 0.10%), Immigrants from Africa (2.4%, a difference of 0.15%), Immigrants from Sudan (2.4%, a difference of 0.17%), and Immigrants from Colombia (2.4%, a difference of 0.18%).
| Demographics | Rating | Rank | Single Father Households |
| Belgians | 43.3 /100 | #182 | Average 2.3% |
| Immigrants | Panama | 41.8 /100 | #183 | Average 2.4% |
| Sri Lankans | 41.8 /100 | #184 | Average 2.4% |
| Nigerians | 41.0 /100 | #185 | Average 2.4% |
| Immigrants | Bosnia and Herzegovina | 40.4 /100 | #186 | Average 2.4% |
| Immigrants | Colombia | 34.0 /100 | #187 | Fair 2.4% |
| Hmong | 33.0 /100 | #188 | Fair 2.4% |
| U.S. Virgin Islanders | 31.8 /100 | #189 | Fair 2.4% |
| French | 31.7 /100 | #190 | Fair 2.4% |
| Immigrants | Africa | 30.0 /100 | #191 | Fair 2.4% |
| Immigrants | Sudan | 29.8 /100 | #192 | Fair 2.4% |
| Uruguayans | 29.7 /100 | #193 | Fair 2.4% |
| Panamanians | 29.6 /100 | #194 | Fair 2.4% |
| Immigrants | Philippines | 28.7 /100 | #195 | Fair 2.4% |
| Kenyans | 28.0 /100 | #196 | Fair 2.4% |