Russian vs Houma Single Father Households
COMPARE
Russian
Houma
Single Father Households
Single Father Households Comparison
Russians
Houma
2.0%
SINGLE FATHER HOUSEHOLDS
100.0/ 100
METRIC RATING
45th/ 347
METRIC RANK
2.9%
SINGLE FATHER HOUSEHOLDS
0.0/ 100
METRIC RATING
316th/ 347
METRIC RANK
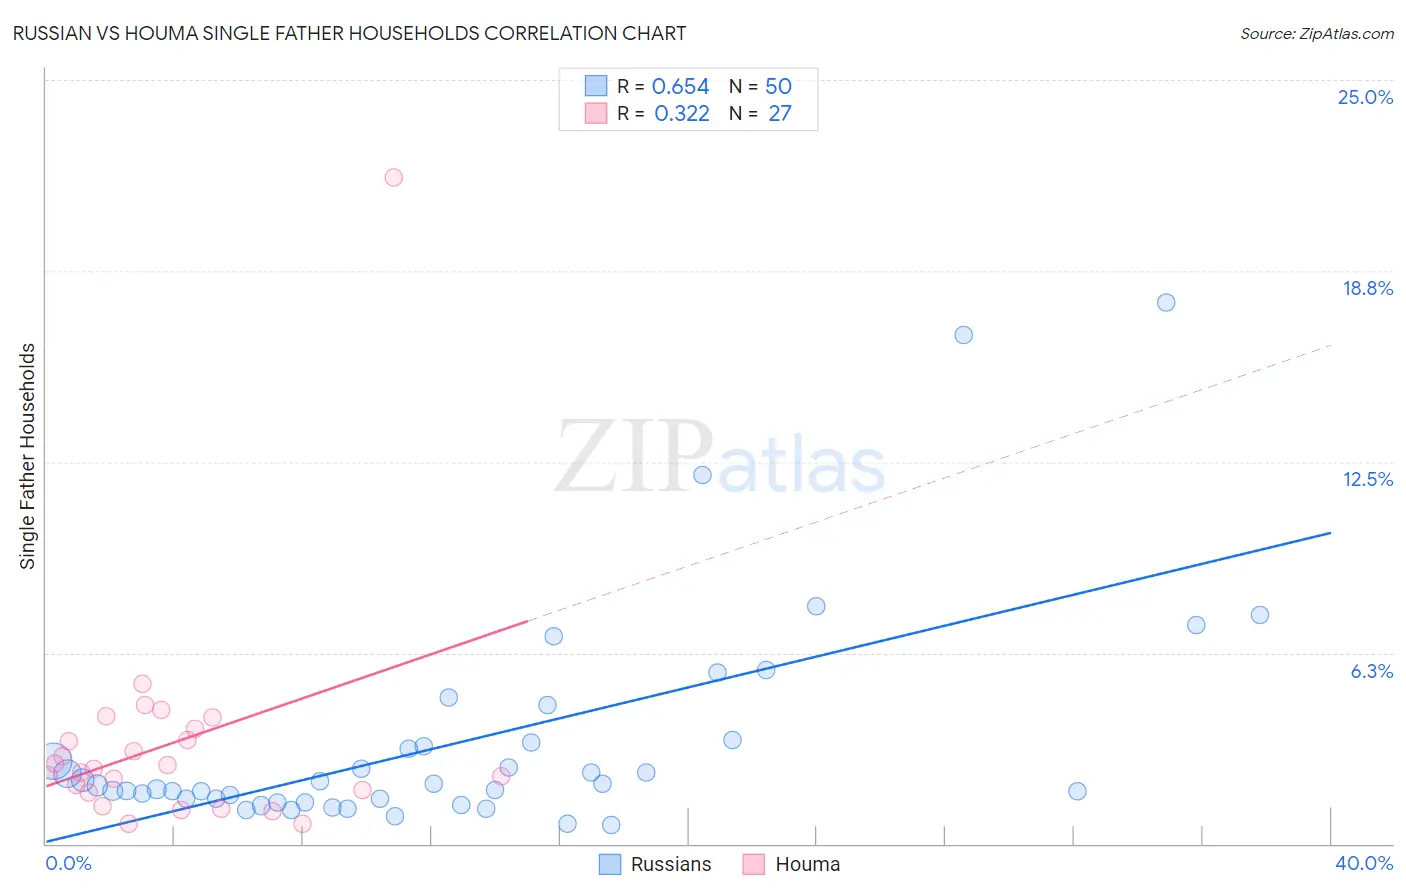
Russian vs Houma Single Father Households Correlation Chart
The statistical analysis conducted on geographies consisting of 503,310,659 people shows a significant positive correlation between the proportion of Russians and percentage of single father households in the United States with a correlation coefficient (R) of 0.654 and weighted average of 2.0%. Similarly, the statistical analysis conducted on geographies consisting of 36,727,905 people shows a mild positive correlation between the proportion of Houma and percentage of single father households in the United States with a correlation coefficient (R) of 0.322 and weighted average of 2.9%, a difference of 45.6%.
Single Father Households Correlation Summary
| Measurement | Russian | Houma |
| Minimum | 0.62% | 0.65% |
| Maximum | 17.7% | 21.8% |
| Range | 17.1% | 21.2% |
| Mean | 3.3% | 3.3% |
| Median | 1.9% | 2.5% |
| Interquartile 25% (IQ1) | 1.5% | 1.7% |
| Interquartile 75% (IQ3) | 3.3% | 3.8% |
| Interquartile Range (IQR) | 1.8% | 2.1% |
| Standard Deviation (Sample) | 3.6% | 3.9% |
| Standard Deviation (Population) | 3.6% | 3.8% |
Similar Demographics by Single Father Households
Demographics Similar to Russians by Single Father Households
In terms of single father households, the demographic groups most similar to Russians are Latvian (2.0%, a difference of 0.020%), Immigrants from Grenada (2.0%, a difference of 0.10%), Immigrants from Lebanon (2.0%, a difference of 0.10%), Macedonian (2.0%, a difference of 0.33%), and Immigrants from Ukraine (2.0%, a difference of 0.46%).
| Demographics | Rating | Rank | Single Father Households |
| Immigrants | Eastern Europe | 100.0 /100 | #38 | Exceptional 2.0% |
| Immigrants | Sri Lanka | 100.0 /100 | #39 | Exceptional 2.0% |
| Immigrants | Bulgaria | 100.0 /100 | #40 | Exceptional 2.0% |
| Immigrants | Turkey | 100.0 /100 | #41 | Exceptional 2.0% |
| Macedonians | 100.0 /100 | #42 | Exceptional 2.0% |
| Immigrants | Grenada | 100.0 /100 | #43 | Exceptional 2.0% |
| Latvians | 100.0 /100 | #44 | Exceptional 2.0% |
| Russians | 100.0 /100 | #45 | Exceptional 2.0% |
| Immigrants | Lebanon | 100.0 /100 | #46 | Exceptional 2.0% |
| Immigrants | Ukraine | 99.9 /100 | #47 | Exceptional 2.0% |
| Immigrants | Kazakhstan | 99.9 /100 | #48 | Exceptional 2.0% |
| Immigrants | Serbia | 99.9 /100 | #49 | Exceptional 2.0% |
| Immigrants | Switzerland | 99.9 /100 | #50 | Exceptional 2.0% |
| Immigrants | Poland | 99.9 /100 | #51 | Exceptional 2.0% |
| Immigrants | Europe | 99.9 /100 | #52 | Exceptional 2.0% |
Demographics Similar to Houma by Single Father Households
In terms of single father households, the demographic groups most similar to Houma are Cheyenne (2.9%, a difference of 0.0%), Salvadoran (2.9%, a difference of 0.39%), Arapaho (2.9%, a difference of 0.64%), Immigrants from El Salvador (2.9%, a difference of 0.86%), and Cape Verdean (2.9%, a difference of 0.87%).
| Demographics | Rating | Rank | Single Father Households |
| Central Americans | 0.0 /100 | #309 | Tragic 2.9% |
| Immigrants | Laos | 0.0 /100 | #310 | Tragic 2.9% |
| Spanish American Indians | 0.0 /100 | #311 | Tragic 2.9% |
| Tsimshian | 0.0 /100 | #312 | Tragic 2.9% |
| Arapaho | 0.0 /100 | #313 | Tragic 2.9% |
| Salvadorans | 0.0 /100 | #314 | Tragic 2.9% |
| Cheyenne | 0.0 /100 | #315 | Tragic 2.9% |
| Houma | 0.0 /100 | #316 | Tragic 2.9% |
| Immigrants | El Salvador | 0.0 /100 | #317 | Tragic 2.9% |
| Cape Verdeans | 0.0 /100 | #318 | Tragic 2.9% |
| Ute | 0.0 /100 | #319 | Tragic 3.0% |
| Guatemalans | 0.0 /100 | #320 | Tragic 3.0% |
| Mexicans | 0.0 /100 | #321 | Tragic 3.0% |
| Immigrants | Guatemala | 0.0 /100 | #322 | Tragic 3.0% |
| Immigrants | Central America | 0.0 /100 | #323 | Tragic 3.0% |