Russian vs Nonimmigrants Single Father Households
COMPARE
Russian
Nonimmigrants
Single Father Households
Single Father Households Comparison
Russians
Nonimmigrants
2.0%
SINGLE FATHER HOUSEHOLDS
100.0/ 100
METRIC RATING
45th/ 347
METRIC RANK
2.4%
SINGLE FATHER HOUSEHOLDS
7.6/ 100
METRIC RATING
231st/ 347
METRIC RANK
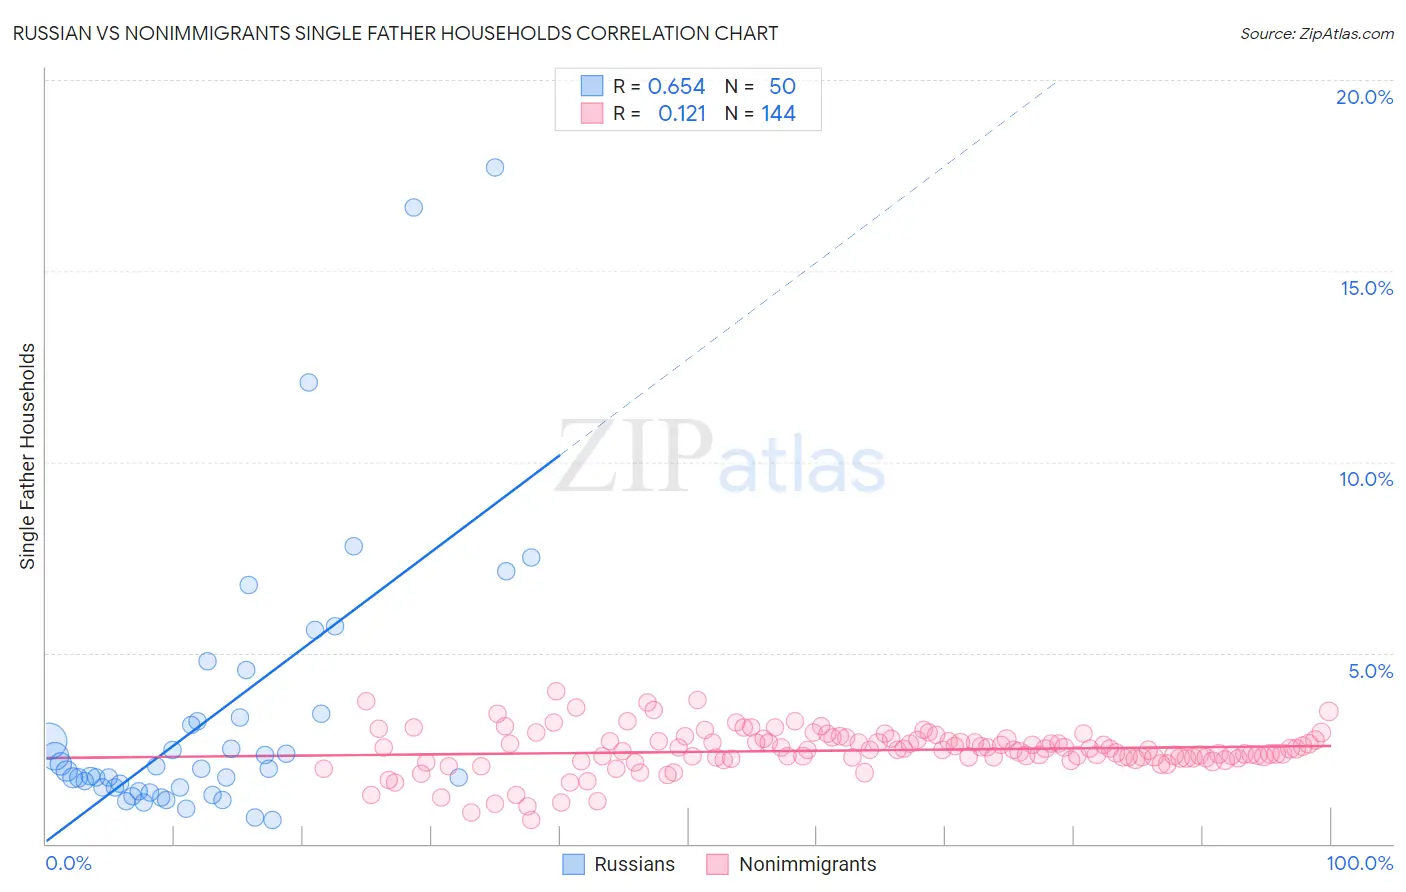
Russian vs Nonimmigrants Single Father Households Correlation Chart
The statistical analysis conducted on geographies consisting of 503,310,659 people shows a significant positive correlation between the proportion of Russians and percentage of single father households in the United States with a correlation coefficient (R) of 0.654 and weighted average of 2.0%. Similarly, the statistical analysis conducted on geographies consisting of 565,890,376 people shows a poor positive correlation between the proportion of Nonimmigrants and percentage of single father households in the United States with a correlation coefficient (R) of 0.121 and weighted average of 2.4%, a difference of 21.9%.
Single Father Households Correlation Summary
| Measurement | Russian | Nonimmigrants |
| Minimum | 0.62% | 0.62% |
| Maximum | 17.7% | 4.0% |
| Range | 17.1% | 3.4% |
| Mean | 3.3% | 2.4% |
| Median | 1.9% | 2.5% |
| Interquartile 25% (IQ1) | 1.5% | 2.2% |
| Interquartile 75% (IQ3) | 3.3% | 2.7% |
| Interquartile Range (IQR) | 1.8% | 0.48% |
| Standard Deviation (Sample) | 3.6% | 0.56% |
| Standard Deviation (Population) | 3.6% | 0.56% |
Similar Demographics by Single Father Households
Demographics Similar to Russians by Single Father Households
In terms of single father households, the demographic groups most similar to Russians are Latvian (2.0%, a difference of 0.020%), Immigrants from Grenada (2.0%, a difference of 0.10%), Immigrants from Lebanon (2.0%, a difference of 0.10%), Macedonian (2.0%, a difference of 0.33%), and Immigrants from Ukraine (2.0%, a difference of 0.46%).
| Demographics | Rating | Rank | Single Father Households |
| Immigrants | Eastern Europe | 100.0 /100 | #38 | Exceptional 2.0% |
| Immigrants | Sri Lanka | 100.0 /100 | #39 | Exceptional 2.0% |
| Immigrants | Bulgaria | 100.0 /100 | #40 | Exceptional 2.0% |
| Immigrants | Turkey | 100.0 /100 | #41 | Exceptional 2.0% |
| Macedonians | 100.0 /100 | #42 | Exceptional 2.0% |
| Immigrants | Grenada | 100.0 /100 | #43 | Exceptional 2.0% |
| Latvians | 100.0 /100 | #44 | Exceptional 2.0% |
| Russians | 100.0 /100 | #45 | Exceptional 2.0% |
| Immigrants | Lebanon | 100.0 /100 | #46 | Exceptional 2.0% |
| Immigrants | Ukraine | 99.9 /100 | #47 | Exceptional 2.0% |
| Immigrants | Kazakhstan | 99.9 /100 | #48 | Exceptional 2.0% |
| Immigrants | Serbia | 99.9 /100 | #49 | Exceptional 2.0% |
| Immigrants | Switzerland | 99.9 /100 | #50 | Exceptional 2.0% |
| Immigrants | Poland | 99.9 /100 | #51 | Exceptional 2.0% |
| Immigrants | Europe | 99.9 /100 | #52 | Exceptional 2.0% |
Demographics Similar to Nonimmigrants by Single Father Households
In terms of single father households, the demographic groups most similar to Nonimmigrants are Pennsylvania German (2.4%, a difference of 0.080%), Immigrants from Western Africa (2.4%, a difference of 0.14%), Subsaharan African (2.4%, a difference of 0.16%), Immigrants from Zaire (2.4%, a difference of 0.25%), and African (2.5%, a difference of 0.34%).
| Demographics | Rating | Rank | Single Father Households |
| Immigrants | Bahamas | 10.6 /100 | #224 | Poor 2.4% |
| Marshallese | 9.7 /100 | #225 | Tragic 2.4% |
| Blacks/African Americans | 9.7 /100 | #226 | Tragic 2.4% |
| Americans | 9.3 /100 | #227 | Tragic 2.4% |
| Immigrants | Ghana | 9.1 /100 | #228 | Tragic 2.4% |
| Immigrants | Zaire | 8.6 /100 | #229 | Tragic 2.4% |
| Sub-Saharan Africans | 8.3 /100 | #230 | Tragic 2.4% |
| Immigrants | Nonimmigrants | 7.6 /100 | #231 | Tragic 2.4% |
| Pennsylvania Germans | 7.3 /100 | #232 | Tragic 2.4% |
| Immigrants | Western Africa | 7.0 /100 | #233 | Tragic 2.4% |
| Africans | 6.3 /100 | #234 | Tragic 2.5% |
| Immigrants | Immigrants | 6.3 /100 | #235 | Tragic 2.5% |
| Cajuns | 6.1 /100 | #236 | Tragic 2.5% |
| Sierra Leoneans | 5.9 /100 | #237 | Tragic 2.5% |
| Immigrants | Sierra Leone | 5.8 /100 | #238 | Tragic 2.5% |