Russian vs New Zealander Single Father Households

COMPARE

Russian
Race
Ancestry
AfghanAfricanAlaska NativeAlaskan AthabascanAlbanianAleutAlsatianAmericanApacheArabArapahoArgentineanArmenianAssyrian/Chaldean/SyriacAustralianAustrianBahamianBangladeshiBarbadianBasqueBelgianBelizeanBermudanBhutaneseBlackfeetBolivianBrazilianBritishBritish West IndianBulgarianBurmeseCajunCambodianCanadianCape VerdeanCarpatho RusynCelticCentral AmericanCentral American IndianCherokeeCheyenneChickasawChileanChineseChippewaChoctawColombianColvilleComancheCosta RicanCreeCreekCroatianCrowCubanCypriotCzechCzechoslovakianDanishDelawareDominicanDutchDutch West IndianEastern EuropeanEcuadorianEgyptianEnglishEstonianEthiopianEuropeanFijianFilipinoFinnishFrenchFrench American IndianFrench CanadianGermanGerman RussianGhanaianGreekGuamanian/ChamorroGuatemalanGuyaneseHaitianHmongHonduranHopiHoumaHungarianIcelanderIndian (Asian)IndonesianInupiatIranianIraqiIrishIroquoisIsraeliItalianJamaicanJapaneseJordanianKenyanKiowaKoreanLaotianLatvianLebaneseLiberianLithuanianLumbeeLuxembourgerMacedonianMalaysianMalteseMarshalleseMenomineeMexicanMexican American IndianMongolianMoroccanNative HawaiianNavajoNepaleseNicaraguanNigerianNorthern EuropeanNorwegianOkinawanOsageOttawaPaiutePakistaniPalestinianPanamanianParaguayanPennsylvania GermanPeruvianPimaPolishPortuguesePotawatomiPuebloPuerto RicanPuget Sound SalishRomanianRussianSalvadoranSamoanScandinavianScotch-IrishScottishSeminoleSenegaleseSerbianShoshoneSierra LeoneanSiouxSlavicSlovakSloveneSomaliSouth AfricanSouth AmericanSouth American IndianSoviet UnionSpaniardSpanishSpanish AmericanSpanish American IndianSri LankanSubsaharan AfricanSudaneseSwedishSwissSyrianTaiwaneseThaiTlingit-HaidaTohono O'OdhamTonganTrinidadian and TobagonianTsimshianTurkishU.S. Virgin IslanderUgandanUkrainianUruguayanUteVenezuelanVietnameseWelshWest IndianYakamaYaquiYugoslavianYumanYup'ikZimbabwean
Immigration
NonimmigrantsImmigrantsAfghanistanAfricaAlbaniaArgentinaArmeniaAsiaAustraliaAustriaBahamasBangladeshBarbadosBelarusBelgiumBelizeBoliviaBosnia and HerzegovinaBrazilBulgariaBurma/MyanmarCabo VerdeCambodiaCameroonCanadaCaribbeanCentral AmericaChileChinaColombiaCongoCosta RicaCroatiaCubaCzechoslovakiaDenmarkDominicaDominican RepublicEastern AfricaEastern AsiaEastern EuropeEcuadorEgyptEl SalvadorEnglandEritreaEthiopiaEuropeFijiFranceGermanyGhanaGreeceGrenadaGuatemalaGuyanaHaitiHondurasHong KongHungaryIndiaIndonesiaIranIraqIrelandIsraelItalyJamaicaJapanJordanKazakhstanKenyaKoreaKuwaitLaosLatin AmericaLatviaLebanonLiberiaLithuaniaMalaysiaMexicoMicronesiaMiddle AfricaMoldovaMoroccoNepalNetherlandsNicaraguaNigeriaNorth AmericaNorth MacedoniaNorthern AfricaNorthern EuropeNorwayOceaniaPakistanPanamaPeruPhilippinesPolandPortugalRomaniaRussiaSaudi ArabiaScotlandSenegalSerbiaSierra LeoneSingaporeSomaliaSouth AfricaSouth AmericaSouth Central AsiaSouth Eastern AsiaSouthern EuropeSpainSri LankaSt. Vincent and the GrenadinesSudanSwedenSwitzerlandSyriaTaiwanThailandTrinidad and TobagoTurkeyUgandaUkraineUruguayUzbekistanVenezuelaVietnamWest IndiesWestern AfricaWestern AsiaWestern EuropeYemenZaireZimbabweAzores
New Zealander
Race
Ancestry
AfghanAfricanAlaska NativeAlaskan AthabascanAlbanianAleutAlsatianAmericanApacheArabArapahoArgentineanArmenianAssyrian/Chaldean/SyriacAustralianAustrianBahamianBangladeshiBarbadianBasqueBelgianBelizeanBermudanBhutaneseBlackfeetBolivianBrazilianBritishBritish West IndianBulgarianBurmeseCajunCambodianCanadianCape VerdeanCarpatho RusynCelticCentral AmericanCentral American IndianCherokeeCheyenneChickasawChileanChineseChippewaChoctawColombianColvilleComancheCosta RicanCreeCreekCroatianCrowCubanCypriotCzechCzechoslovakianDanishDelawareDominicanDutchDutch West IndianEastern EuropeanEcuadorianEgyptianEnglishEstonianEthiopianEuropeanFijianFilipinoFinnishFrenchFrench American IndianFrench CanadianGermanGerman RussianGhanaianGreekGuamanian/ChamorroGuatemalanGuyaneseHaitianHmongHonduranHopiHoumaHungarianIcelanderIndian (Asian)IndonesianInupiatIranianIraqiIrishIroquoisIsraeliItalianJamaicanJapaneseJordanianKenyanKiowaKoreanLaotianLatvianLebaneseLiberianLithuanianLumbeeLuxembourgerMacedonianMalaysianMalteseMarshalleseMenomineeMexicanMexican American IndianMongolianMoroccanNative HawaiianNavajoNepaleseNew ZealanderNicaraguanNigerianNorthern EuropeanNorwegianOkinawanOsageOttawaPaiutePakistaniPalestinianPanamanianParaguayanPennsylvania GermanPeruvianPimaPolishPortuguesePotawatomiPuebloPuerto RicanPuget Sound SalishRomanianSalvadoranSamoanScandinavianScotch-IrishScottishSeminoleSenegaleseSerbianShoshoneSierra LeoneanSiouxSlavicSlovakSloveneSomaliSouth AfricanSouth AmericanSouth American IndianSoviet UnionSpaniardSpanishSpanish AmericanSpanish American IndianSri LankanSubsaharan AfricanSudaneseSwedishSwissSyrianTaiwaneseThaiTlingit-HaidaTohono O'OdhamTonganTrinidadian and TobagonianTsimshianTurkishU.S. Virgin IslanderUgandanUkrainianUruguayanUteVenezuelanVietnameseWelshWest IndianYakamaYaquiYugoslavianYumanYup'ikZimbabwean
Immigration
NonimmigrantsImmigrantsAfghanistanAfricaAlbaniaArgentinaArmeniaAsiaAustraliaAustriaBahamasBangladeshBarbadosBelarusBelgiumBelizeBoliviaBosnia and HerzegovinaBrazilBulgariaBurma/MyanmarCabo VerdeCambodiaCameroonCanadaCaribbeanCentral AmericaChileChinaColombiaCongoCosta RicaCroatiaCubaCzechoslovakiaDenmarkDominicaDominican RepublicEastern AfricaEastern AsiaEastern EuropeEcuadorEgyptEl SalvadorEnglandEritreaEthiopiaEuropeFijiFranceGermanyGhanaGreeceGrenadaGuatemalaGuyanaHaitiHondurasHong KongHungaryIndiaIndonesiaIranIraqIrelandIsraelItalyJamaicaJapanJordanKazakhstanKenyaKoreaKuwaitLaosLatin AmericaLatviaLebanonLiberiaLithuaniaMalaysiaMexicoMicronesiaMiddle AfricaMoldovaMoroccoNepalNetherlandsNicaraguaNigeriaNorth AmericaNorth MacedoniaNorthern AfricaNorthern EuropeNorwayOceaniaPakistanPanamaPeruPhilippinesPolandPortugalRomaniaRussiaSaudi ArabiaScotlandSenegalSerbiaSierra LeoneSingaporeSomaliaSouth AfricaSouth AmericaSouth Central AsiaSouth Eastern AsiaSouthern EuropeSpainSri LankaSt. Vincent and the GrenadinesSudanSwedenSwitzerlandSyriaTaiwanThailandTrinidad and TobagoTurkeyUgandaUkraineUruguayUzbekistanVenezuelaVietnamWest IndiesWestern AfricaWestern AsiaWestern EuropeYemenZaireZimbabweAzores
Single Father Households
Income
Poverty
Unemployment
Labor Participation
Family Structure
Vehicle Availability
Education Level
Disability

Single Father Households Comparison

Russians

New Zealanders

Exceptional
Exceptional
2.0%
SINGLE FATHER HOUSEHOLDS
100.0/ 100
METRIC RATING
45th/ 347
METRIC RANK
2.1%
SINGLE FATHER HOUSEHOLDS
99.7/ 100
METRIC RATING
82nd/ 347
METRIC RANK

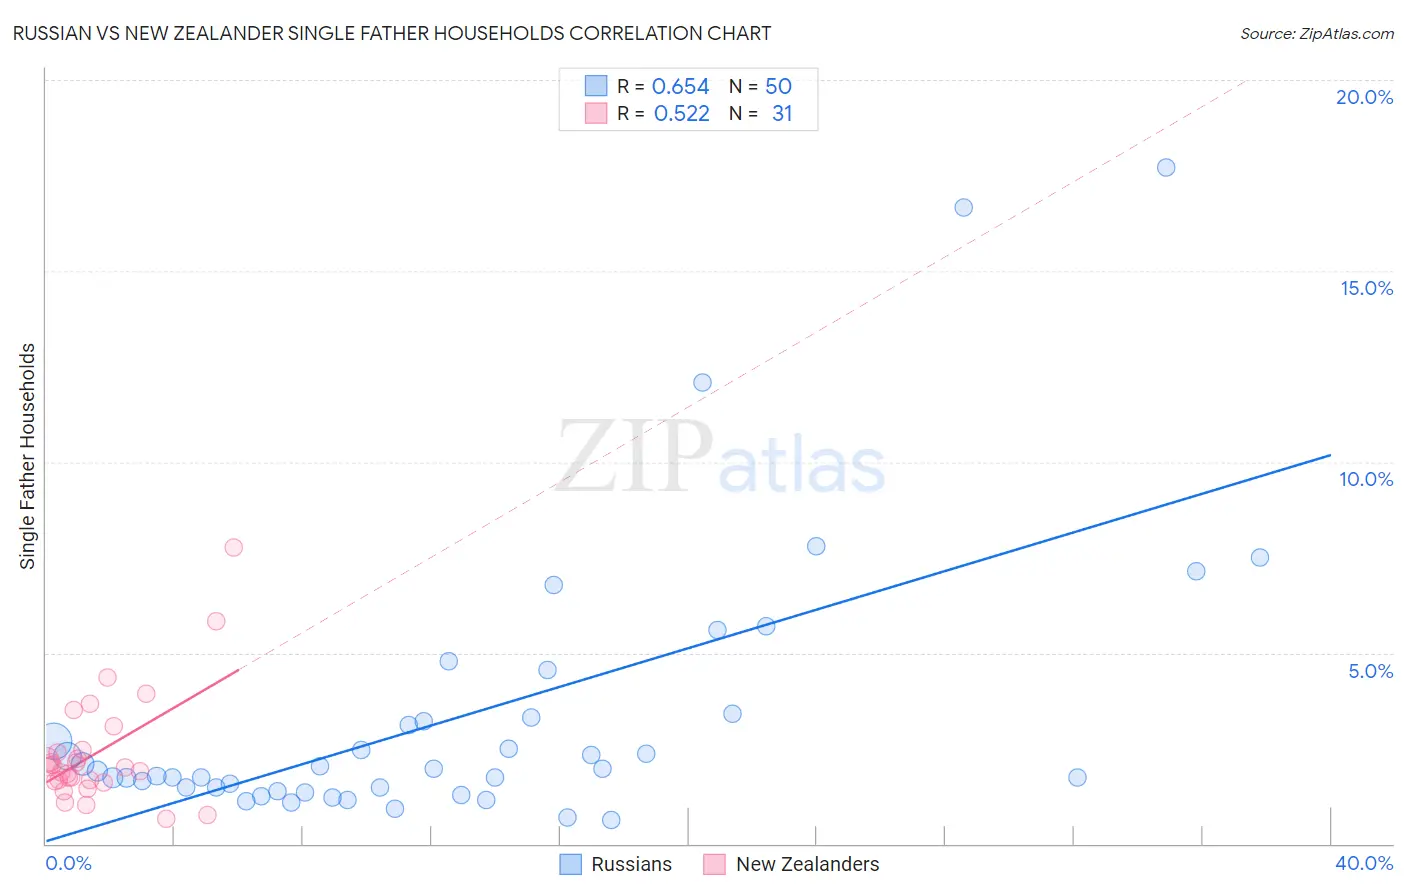
Russian vs New Zealander Single Father Households Correlation Chart

The statistical analysis conducted on geographies consisting of 503,310,659 people shows a significant positive correlation between the proportion of Russians and percentage of single father households in the United States with a correlation coefficient (R) of 0.654 and weighted average of 2.0%. Similarly, the statistical analysis conducted on geographies consisting of 106,675,257 people shows a substantial positive correlation between the proportion of New Zealanders and percentage of single father households in the United States with a correlation coefficient (R) of 0.522 and weighted average of 2.1%, a difference of 4.2%.
Russian vs New Zealander Single Father Households

Single Father Households Correlation Summary

MeasurementRussianNew Zealander
Minimum0.62%0.66%
Maximum17.7%7.8%
Range17.1%7.1%
Mean3.3%2.4%
Median1.9%2.0%
Interquartile 25% (IQ1)1.5%1.6%
Interquartile 75% (IQ3)3.3%2.5%
Interquartile Range (IQR)1.8%0.84%
Standard Deviation (Sample)3.6%1.5%
Standard Deviation (Population)3.6%1.5%

Similar Demographics by Single Father Households

Demographics Similar to Russians by Single Father Households

In terms of single father households, the demographic groups most similar to Russians are Latvian (2.0%, a difference of 0.020%), Immigrants from Grenada (2.0%, a difference of 0.10%), Immigrants from Lebanon (2.0%, a difference of 0.10%), Macedonian (2.0%, a difference of 0.33%), and Immigrants from Ukraine (2.0%, a difference of 0.46%).
DemographicsRating | RankSingle Father Households
Immigrants | Eastern Europe
100.0
/100
|
#38
Exceptional
2.0%
Immigrants | Sri Lanka
100.0
/100
|
#39
Exceptional
2.0%
Immigrants | Bulgaria
100.0
/100
|
#40
Exceptional
2.0%
Immigrants | Turkey
100.0
/100
|
#41
Exceptional
2.0%
Macedonians
100.0
/100
|
#42
Exceptional
2.0%
Immigrants | Grenada
100.0
/100
|
#43
Exceptional
2.0%
Latvians
100.0
/100
|
#44
Exceptional
2.0%
Russians
100.0
/100
|
#45
Exceptional
2.0%
Immigrants | Lebanon
100.0
/100
|
#46
Exceptional
2.0%
Immigrants | Ukraine
99.9
/100
|
#47
Exceptional
2.0%
Immigrants | Kazakhstan
99.9
/100
|
#48
Exceptional
2.0%
Immigrants | Serbia
99.9
/100
|
#49
Exceptional
2.0%
Immigrants | Switzerland
99.9
/100
|
#50
Exceptional
2.0%
Immigrants | Poland
99.9
/100
|
#51
Exceptional
2.0%
Immigrants | Europe
99.9
/100
|
#52
Exceptional
2.0%

Demographics Similar to New Zealanders by Single Father Households

In terms of single father households, the demographic groups most similar to New Zealanders are Greek (2.1%, a difference of 0.010%), Armenian (2.1%, a difference of 0.050%), Immigrants from South Africa (2.1%, a difference of 0.13%), Immigrants from Asia (2.1%, a difference of 0.22%), and Carpatho Rusyn (2.1%, a difference of 0.31%).
DemographicsRating | RankSingle Father Households
Immigrants | Sweden
99.8
/100
|
#75
Exceptional
2.1%
Immigrants | Scotland
99.8
/100
|
#76
Exceptional
2.1%
Immigrants | Saudi Arabia
99.8
/100
|
#77
Exceptional
2.1%
Estonians
99.7
/100
|
#78
Exceptional
2.1%
Immigrants | Asia
99.7
/100
|
#79
Exceptional
2.1%
Immigrants | South Africa
99.7
/100
|
#80
Exceptional
2.1%
Armenians
99.7
/100
|
#81
Exceptional
2.1%
New Zealanders
99.7
/100
|
#82
Exceptional
2.1%
Greeks
99.7
/100
|
#83
Exceptional
2.1%
Carpatho Rusyns
99.6
/100
|
#84
Exceptional
2.1%
Immigrants | Hungary
99.6
/100
|
#85
Exceptional
2.1%
Asians
99.6
/100
|
#86
Exceptional
2.1%
Lithuanians
99.5
/100
|
#87
Exceptional
2.1%
Bhutanese
99.5
/100
|
#88
Exceptional
2.1%
Immigrants | Armenia
99.5
/100
|
#89
Exceptional
2.1%