Puerto Rican vs Slovene Family Households
COMPARE
Puerto Rican
Slovene
Family Households
Family Households Comparison
Puerto Ricans
Slovenes
64.2%
FAMILY HOUSEHOLDS
33.4/ 100
METRIC RATING
184th/ 347
METRIC RANK
62.4%
FAMILY HOUSEHOLDS
0.0/ 100
METRIC RATING
296th/ 347
METRIC RANK
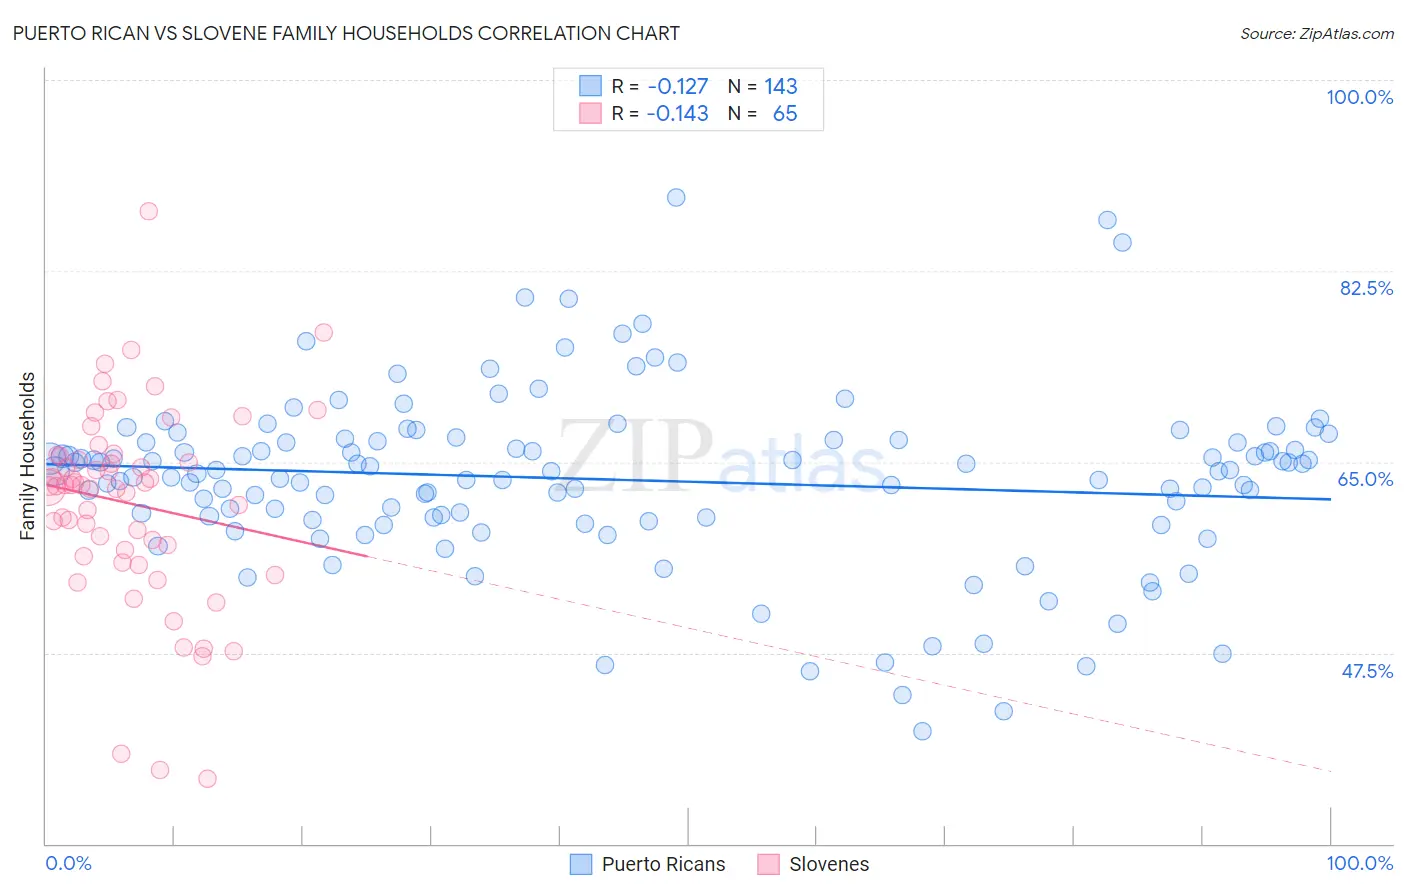
Puerto Rican vs Slovene Family Households Correlation Chart
The statistical analysis conducted on geographies consisting of 527,724,488 people shows a poor negative correlation between the proportion of Puerto Ricans and percentage of family households in the United States with a correlation coefficient (R) of -0.127 and weighted average of 64.2%. Similarly, the statistical analysis conducted on geographies consisting of 261,256,985 people shows a poor negative correlation between the proportion of Slovenes and percentage of family households in the United States with a correlation coefficient (R) of -0.143 and weighted average of 62.4%, a difference of 2.7%.
Family Households Correlation Summary
| Measurement | Puerto Rican | Slovene |
| Minimum | 40.3% | 35.9% |
| Maximum | 89.2% | 88.0% |
| Range | 48.9% | 52.0% |
| Mean | 63.4% | 61.2% |
| Median | 64.2% | 62.8% |
| Interquartile 25% (IQ1) | 59.9% | 56.6% |
| Interquartile 75% (IQ3) | 67.0% | 65.5% |
| Interquartile Range (IQR) | 7.1% | 9.0% |
| Standard Deviation (Sample) | 8.0% | 9.1% |
| Standard Deviation (Population) | 8.0% | 9.1% |
Similar Demographics by Family Households
Demographics Similar to Puerto Ricans by Family Households
In terms of family households, the demographic groups most similar to Puerto Ricans are Creek (64.2%, a difference of 0.010%), Immigrants from Honduras (64.2%, a difference of 0.020%), Immigrants from Trinidad and Tobago (64.2%, a difference of 0.020%), Ukrainian (64.2%, a difference of 0.020%), and Immigrants from Iran (64.1%, a difference of 0.050%).
| Demographics | Rating | Rank | Family Households |
| Immigrants | Micronesia | 42.3 /100 | #177 | Average 64.2% |
| Jamaicans | 40.6 /100 | #178 | Average 64.2% |
| Immigrants | Ukraine | 38.2 /100 | #179 | Fair 64.2% |
| Immigrants | Honduras | 35.0 /100 | #180 | Fair 64.2% |
| Immigrants | Trinidad and Tobago | 34.9 /100 | #181 | Fair 64.2% |
| Ukrainians | 34.6 /100 | #182 | Fair 64.2% |
| Creek | 34.1 /100 | #183 | Fair 64.2% |
| Puerto Ricans | 33.4 /100 | #184 | Fair 64.2% |
| Immigrants | Iran | 30.4 /100 | #185 | Fair 64.1% |
| Spanish Americans | 30.1 /100 | #186 | Fair 64.1% |
| Northern Europeans | 28.2 /100 | #187 | Fair 64.1% |
| Paraguayans | 26.7 /100 | #188 | Fair 64.1% |
| Immigrants | Western Asia | 25.3 /100 | #189 | Fair 64.1% |
| Zimbabweans | 24.7 /100 | #190 | Fair 64.1% |
| Arabs | 24.5 /100 | #191 | Fair 64.1% |
Demographics Similar to Slovenes by Family Households
In terms of family households, the demographic groups most similar to Slovenes are Okinawan (62.5%, a difference of 0.010%), French American Indian (62.4%, a difference of 0.010%), Barbadian (62.5%, a difference of 0.020%), Immigrants from Spain (62.4%, a difference of 0.040%), and Immigrants from Sweden (62.5%, a difference of 0.090%).
| Demographics | Rating | Rank | Family Households |
| Immigrants | Nepal | 0.1 /100 | #289 | Tragic 62.7% |
| Immigrants | Grenada | 0.0 /100 | #290 | Tragic 62.6% |
| U.S. Virgin Islanders | 0.0 /100 | #291 | Tragic 62.6% |
| Immigrants | Burma/Myanmar | 0.0 /100 | #292 | Tragic 62.6% |
| Immigrants | Sweden | 0.0 /100 | #293 | Tragic 62.5% |
| Barbadians | 0.0 /100 | #294 | Tragic 62.5% |
| Okinawans | 0.0 /100 | #295 | Tragic 62.5% |
| Slovenes | 0.0 /100 | #296 | Tragic 62.4% |
| French American Indians | 0.0 /100 | #297 | Tragic 62.4% |
| Immigrants | Spain | 0.0 /100 | #298 | Tragic 62.4% |
| Immigrants | Kuwait | 0.0 /100 | #299 | Tragic 62.4% |
| Immigrants | Africa | 0.0 /100 | #300 | Tragic 62.4% |
| Immigrants | Albania | 0.0 /100 | #301 | Tragic 62.4% |
| Immigrants | Kenya | 0.0 /100 | #302 | Tragic 62.3% |
| Cree | 0.0 /100 | #303 | Tragic 62.3% |