Immigrants from the Azores vs Italian Family Households
COMPARE
Immigrants from the Azores
Italian
Family Households
Family Households Comparison
Immigrants from the Azores
Italians
65.6%
FAMILY HOUSEHOLDS
99.8/ 100
METRIC RATING
76th/ 347
METRIC RANK
64.8%
FAMILY HOUSEHOLDS
91.9/ 100
METRIC RATING
128th/ 347
METRIC RANK
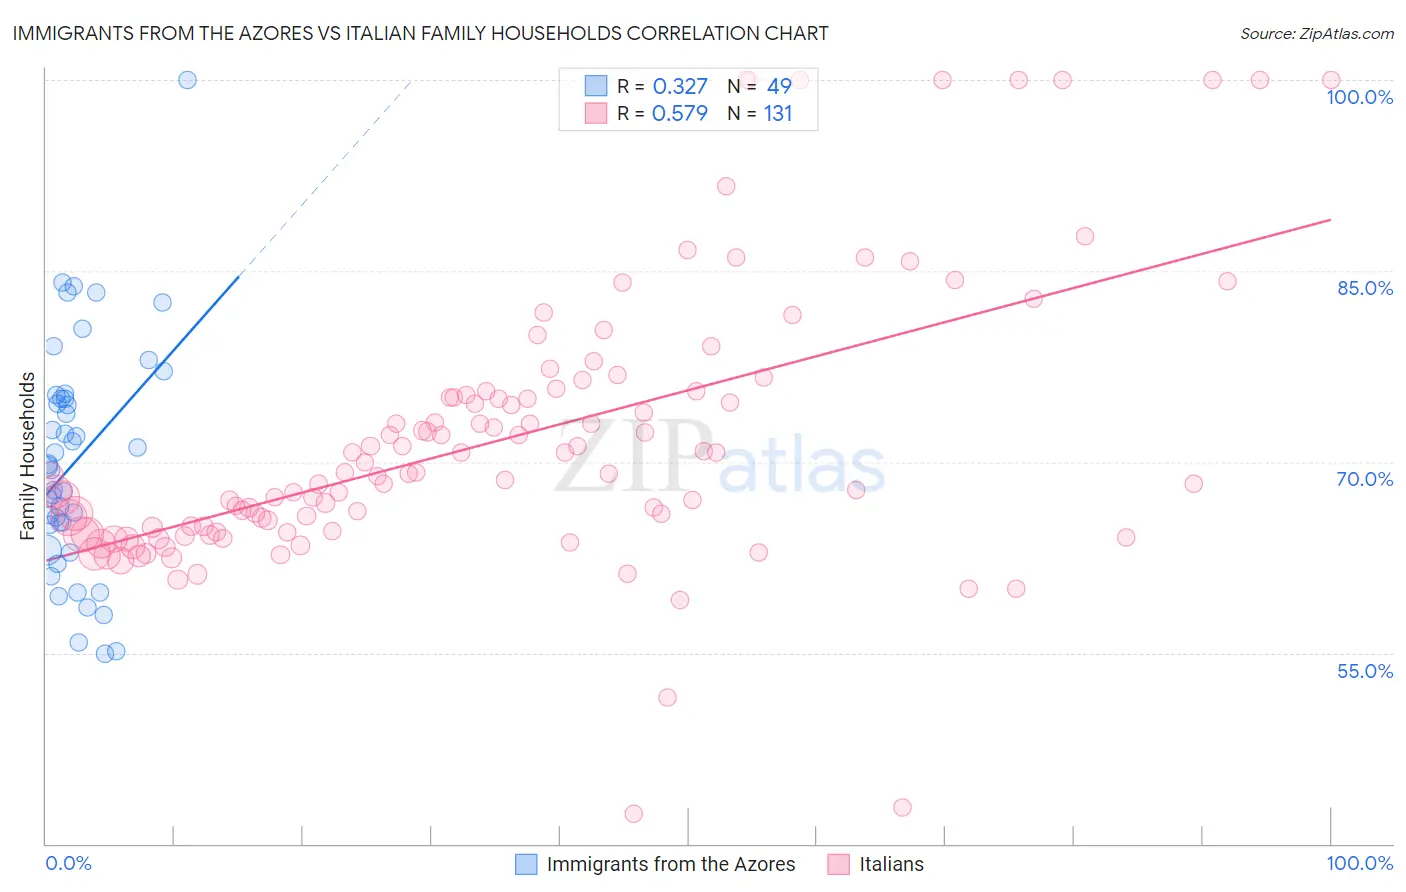
Immigrants from the Azores vs Italian Family Households Correlation Chart
The statistical analysis conducted on geographies consisting of 46,257,310 people shows a mild positive correlation between the proportion of Immigrants from the Azores and percentage of family households in the United States with a correlation coefficient (R) of 0.327 and weighted average of 65.6%. Similarly, the statistical analysis conducted on geographies consisting of 574,452,488 people shows a substantial positive correlation between the proportion of Italians and percentage of family households in the United States with a correlation coefficient (R) of 0.579 and weighted average of 64.8%, a difference of 1.3%.
Family Households Correlation Summary
| Measurement | Immigrants from the Azores | Italian |
| Minimum | 54.9% | 42.4% |
| Maximum | 100.0% | 100.0% |
| Range | 45.1% | 57.6% |
| Mean | 70.1% | 71.7% |
| Median | 69.6% | 69.1% |
| Interquartile 25% (IQ1) | 64.1% | 64.5% |
| Interquartile 75% (IQ3) | 75.1% | 75.2% |
| Interquartile Range (IQR) | 11.0% | 10.7% |
| Standard Deviation (Sample) | 9.1% | 10.9% |
| Standard Deviation (Population) | 9.0% | 10.8% |
Similar Demographics by Family Households
Demographics Similar to Immigrants from the Azores by Family Households
In terms of family households, the demographic groups most similar to Immigrants from the Azores are Immigrants from South America (65.6%, a difference of 0.010%), Yaqui (65.6%, a difference of 0.010%), Immigrants from Costa Rica (65.6%, a difference of 0.040%), Puget Sound Salish (65.6%, a difference of 0.060%), and Houma (65.7%, a difference of 0.12%).
| Demographics | Rating | Rank | Family Households |
| Malaysians | 99.9 /100 | #69 | Exceptional 65.9% |
| Immigrants | Afghanistan | 99.9 /100 | #70 | Exceptional 65.9% |
| Bhutanese | 99.9 /100 | #71 | Exceptional 65.9% |
| Portuguese | 99.9 /100 | #72 | Exceptional 65.8% |
| Laotians | 99.9 /100 | #73 | Exceptional 65.8% |
| Burmese | 99.9 /100 | #74 | Exceptional 65.7% |
| Houma | 99.9 /100 | #75 | Exceptional 65.7% |
| Immigrants | Azores | 99.8 /100 | #76 | Exceptional 65.6% |
| Immigrants | South America | 99.8 /100 | #77 | Exceptional 65.6% |
| Yaqui | 99.8 /100 | #78 | Exceptional 65.6% |
| Immigrants | Costa Rica | 99.8 /100 | #79 | Exceptional 65.6% |
| Puget Sound Salish | 99.8 /100 | #80 | Exceptional 65.6% |
| Jordanians | 99.7 /100 | #81 | Exceptional 65.5% |
| Immigrants | Lebanon | 99.7 /100 | #82 | Exceptional 65.5% |
| Immigrants | Guyana | 99.6 /100 | #83 | Exceptional 65.5% |
Demographics Similar to Italians by Family Households
In terms of family households, the demographic groups most similar to Italians are Immigrants from Panama (64.8%, a difference of 0.010%), Panamanian (64.8%, a difference of 0.020%), Immigrants from Ecuador (64.8%, a difference of 0.020%), Immigrants from Argentina (64.9%, a difference of 0.040%), and Immigrants from Belize (64.9%, a difference of 0.040%).
| Demographics | Rating | Rank | Family Households |
| Hungarians | 94.0 /100 | #121 | Exceptional 64.9% |
| Hmong | 93.4 /100 | #122 | Exceptional 64.9% |
| Choctaw | 93.4 /100 | #123 | Exceptional 64.9% |
| Immigrants | Argentina | 92.8 /100 | #124 | Exceptional 64.9% |
| Immigrants | Belize | 92.7 /100 | #125 | Exceptional 64.9% |
| Panamanians | 92.4 /100 | #126 | Exceptional 64.8% |
| Immigrants | Panama | 92.0 /100 | #127 | Exceptional 64.8% |
| Italians | 91.9 /100 | #128 | Exceptional 64.8% |
| Immigrants | Ecuador | 91.4 /100 | #129 | Exceptional 64.8% |
| Immigrants | Italy | 90.2 /100 | #130 | Exceptional 64.8% |
| Immigrants | Nonimmigrants | 90.1 /100 | #131 | Exceptional 64.8% |
| Cajuns | 89.4 /100 | #132 | Excellent 64.8% |
| Belizeans | 89.3 /100 | #133 | Excellent 64.8% |
| Greeks | 88.1 /100 | #134 | Excellent 64.7% |
| Maltese | 87.4 /100 | #135 | Excellent 64.7% |