Puerto Rican vs Immigrants from North America Family Households
COMPARE
Puerto Rican
Immigrants from North America
Family Households
Family Households Comparison
Puerto Ricans
Immigrants from North America
64.2%
FAMILY HOUSEHOLDS
33.4/ 100
METRIC RATING
184th/ 347
METRIC RANK
64.0%
FAMILY HOUSEHOLDS
20.0/ 100
METRIC RATING
195th/ 347
METRIC RANK
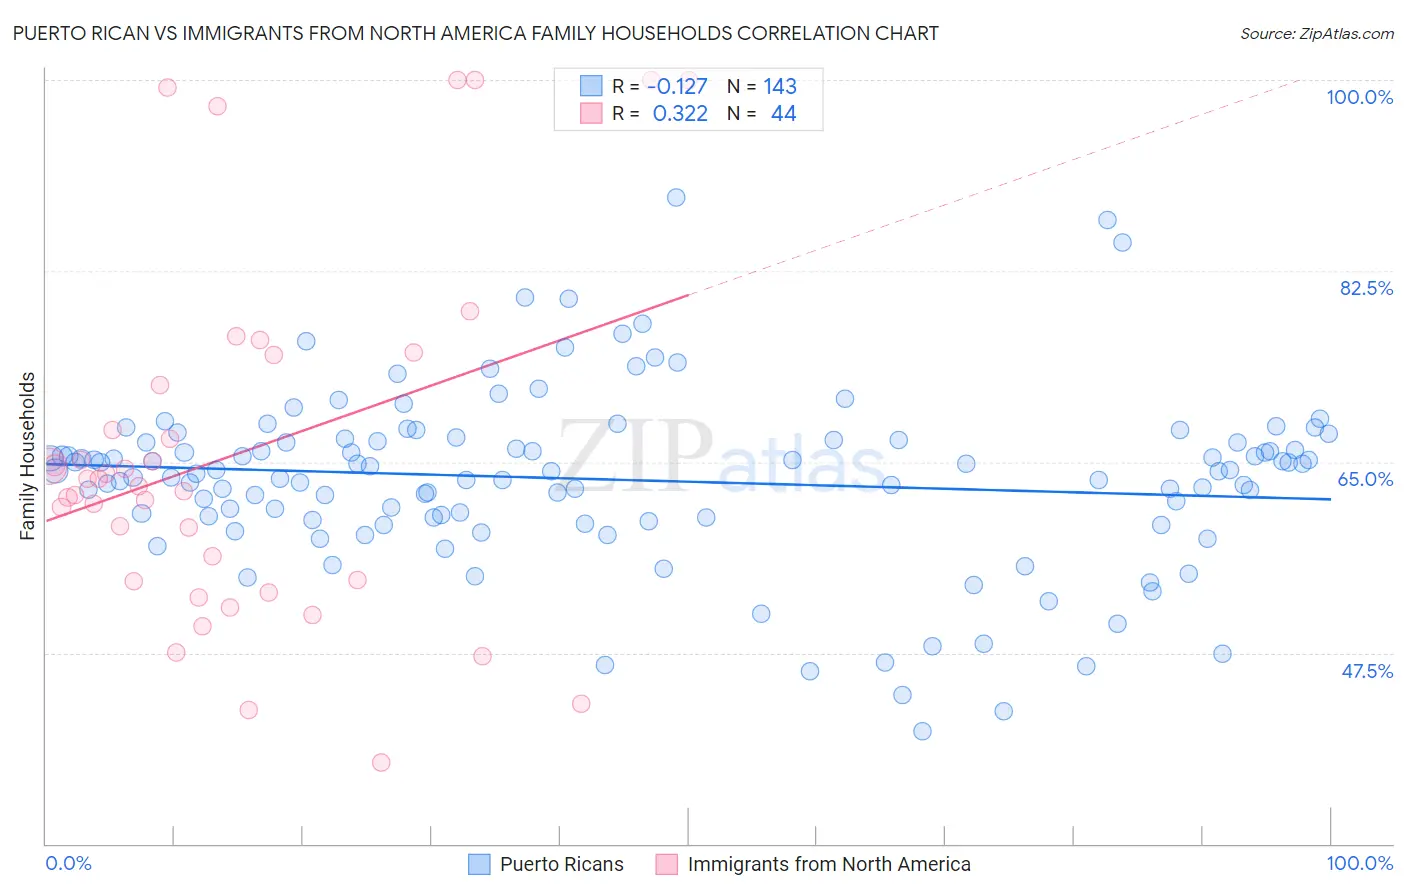
Puerto Rican vs Immigrants from North America Family Households Correlation Chart
The statistical analysis conducted on geographies consisting of 527,724,488 people shows a poor negative correlation between the proportion of Puerto Ricans and percentage of family households in the United States with a correlation coefficient (R) of -0.127 and weighted average of 64.2%. Similarly, the statistical analysis conducted on geographies consisting of 462,193,298 people shows a mild positive correlation between the proportion of Immigrants from North America and percentage of family households in the United States with a correlation coefficient (R) of 0.322 and weighted average of 64.0%, a difference of 0.24%.
Family Households Correlation Summary
| Measurement | Puerto Rican | Immigrants from North America |
| Minimum | 40.3% | 37.5% |
| Maximum | 89.2% | 100.0% |
| Range | 48.9% | 62.5% |
| Mean | 63.4% | 65.7% |
| Median | 64.2% | 63.1% |
| Interquartile 25% (IQ1) | 59.9% | 54.1% |
| Interquartile 75% (IQ3) | 67.0% | 73.4% |
| Interquartile Range (IQR) | 7.1% | 19.3% |
| Standard Deviation (Sample) | 8.0% | 16.4% |
| Standard Deviation (Population) | 8.0% | 16.2% |
Demographics Similar to Puerto Ricans and Immigrants from North America by Family Households
In terms of family households, the demographic groups most similar to Puerto Ricans are Creek (64.2%, a difference of 0.010%), Immigrants from Honduras (64.2%, a difference of 0.020%), Immigrants from Trinidad and Tobago (64.2%, a difference of 0.020%), Ukrainian (64.2%, a difference of 0.020%), and Immigrants from Iran (64.1%, a difference of 0.050%). Similarly, the demographic groups most similar to Immigrants from North America are Immigrants from Canada (64.0%, a difference of 0.020%), Seminole (64.0%, a difference of 0.020%), Polish (64.0%, a difference of 0.020%), Slavic (64.0%, a difference of 0.030%), and Paiute (64.0%, a difference of 0.040%).
| Demographics | Rating | Rank | Family Households |
| Immigrants | Ukraine | 38.2 /100 | #179 | Fair 64.2% |
| Immigrants | Honduras | 35.0 /100 | #180 | Fair 64.2% |
| Immigrants | Trinidad and Tobago | 34.9 /100 | #181 | Fair 64.2% |
| Ukrainians | 34.6 /100 | #182 | Fair 64.2% |
| Creek | 34.1 /100 | #183 | Fair 64.2% |
| Puerto Ricans | 33.4 /100 | #184 | Fair 64.2% |
| Immigrants | Iran | 30.4 /100 | #185 | Fair 64.1% |
| Spanish Americans | 30.1 /100 | #186 | Fair 64.1% |
| Northern Europeans | 28.2 /100 | #187 | Fair 64.1% |
| Paraguayans | 26.7 /100 | #188 | Fair 64.1% |
| Immigrants | Western Asia | 25.3 /100 | #189 | Fair 64.1% |
| Zimbabweans | 24.7 /100 | #190 | Fair 64.1% |
| Arabs | 24.5 /100 | #191 | Fair 64.1% |
| Lithuanians | 23.8 /100 | #192 | Fair 64.0% |
| French | 23.7 /100 | #193 | Fair 64.0% |
| Paiute | 22.2 /100 | #194 | Fair 64.0% |
| Immigrants | North America | 20.0 /100 | #195 | Poor 64.0% |
| Immigrants | Canada | 19.2 /100 | #196 | Poor 64.0% |
| Seminole | 18.9 /100 | #197 | Poor 64.0% |
| Poles | 18.9 /100 | #198 | Poor 64.0% |
| Slavs | 18.6 /100 | #199 | Poor 64.0% |