Norwegian vs Italian Family Households
COMPARE
Norwegian
Italian
Family Households
Family Households Comparison
Norwegians
Italians
63.9%
FAMILY HOUSEHOLDS
13.2/ 100
METRIC RATING
203rd/ 347
METRIC RANK
64.8%
FAMILY HOUSEHOLDS
91.9/ 100
METRIC RATING
128th/ 347
METRIC RANK
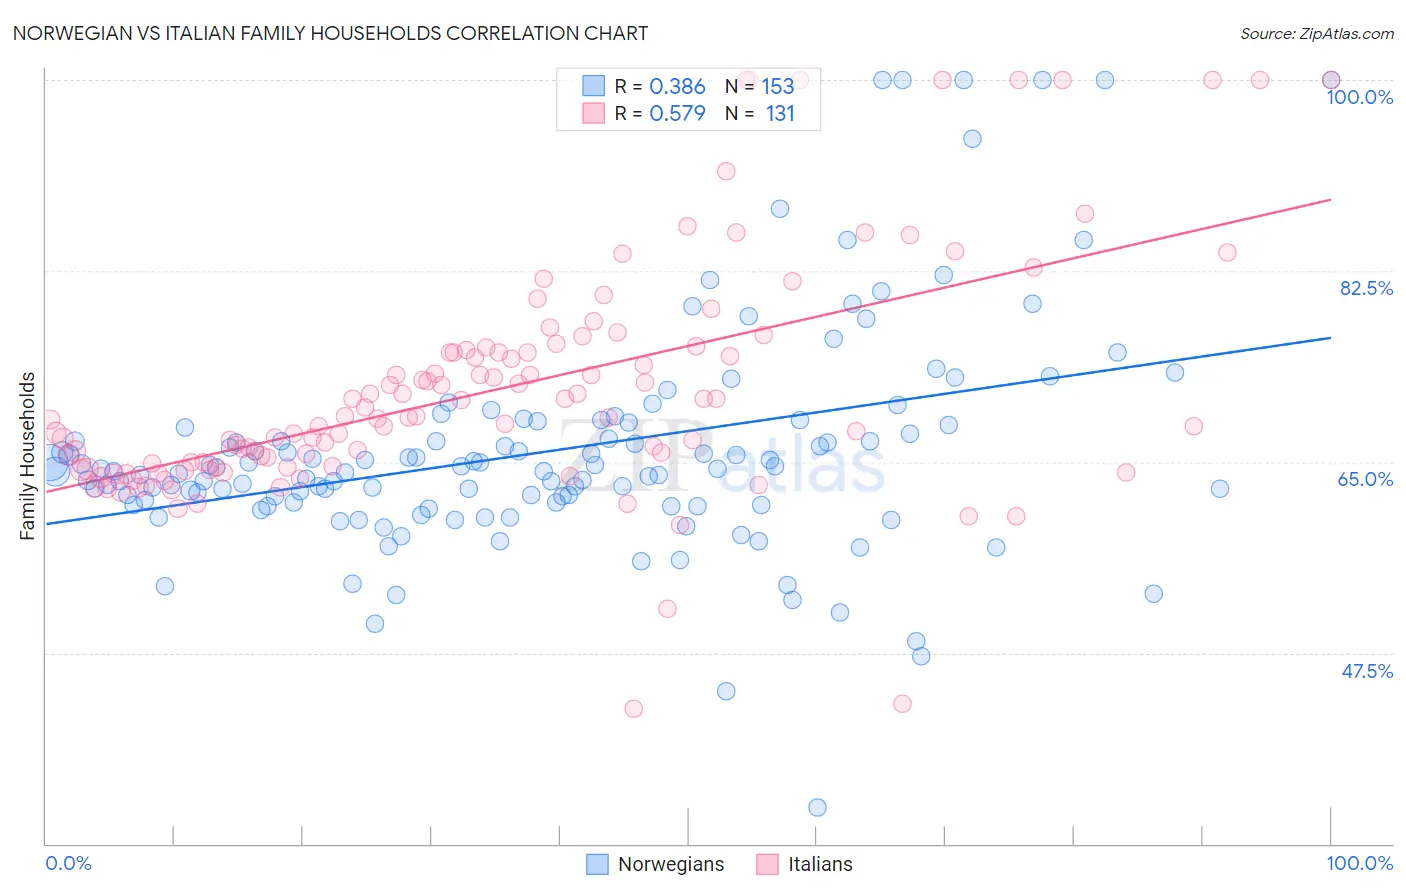
Norwegian vs Italian Family Households Correlation Chart
The statistical analysis conducted on geographies consisting of 532,913,401 people shows a mild positive correlation between the proportion of Norwegians and percentage of family households in the United States with a correlation coefficient (R) of 0.386 and weighted average of 63.9%. Similarly, the statistical analysis conducted on geographies consisting of 574,452,488 people shows a substantial positive correlation between the proportion of Italians and percentage of family households in the United States with a correlation coefficient (R) of 0.579 and weighted average of 64.8%, a difference of 1.5%.
Family Households Correlation Summary
| Measurement | Norwegian | Italian |
| Minimum | 33.3% | 42.4% |
| Maximum | 100.0% | 100.0% |
| Range | 66.7% | 57.6% |
| Mean | 66.0% | 71.7% |
| Median | 64.2% | 69.1% |
| Interquartile 25% (IQ1) | 61.1% | 64.5% |
| Interquartile 75% (IQ3) | 68.3% | 75.2% |
| Interquartile Range (IQR) | 7.1% | 10.7% |
| Standard Deviation (Sample) | 10.4% | 10.9% |
| Standard Deviation (Population) | 10.4% | 10.8% |
Similar Demographics by Family Households
Demographics Similar to Norwegians by Family Households
In terms of family households, the demographic groups most similar to Norwegians are Iranian (63.9%, a difference of 0.010%), Immigrants from Uruguay (63.9%, a difference of 0.010%), Brazilian (63.9%, a difference of 0.030%), Immigrants from Lithuania (63.9%, a difference of 0.030%), and Nigerian (63.9%, a difference of 0.060%).
| Demographics | Rating | Rank | Family Households |
| Immigrants | Canada | 19.2 /100 | #196 | Poor 64.0% |
| Seminole | 18.9 /100 | #197 | Poor 64.0% |
| Poles | 18.9 /100 | #198 | Poor 64.0% |
| Slavs | 18.6 /100 | #199 | Poor 64.0% |
| Immigrants | Malaysia | 17.9 /100 | #200 | Poor 64.0% |
| Immigrants | Eastern Europe | 17.2 /100 | #201 | Poor 64.0% |
| Iranians | 13.5 /100 | #202 | Poor 63.9% |
| Norwegians | 13.2 /100 | #203 | Poor 63.9% |
| Immigrants | Uruguay | 12.8 /100 | #204 | Poor 63.9% |
| Brazilians | 12.4 /100 | #205 | Poor 63.9% |
| Immigrants | Lithuania | 12.1 /100 | #206 | Poor 63.9% |
| Nigerians | 11.5 /100 | #207 | Poor 63.9% |
| Immigrants | Bangladesh | 11.4 /100 | #208 | Poor 63.9% |
| Sierra Leoneans | 11.2 /100 | #209 | Poor 63.9% |
| Immigrants | Thailand | 9.6 /100 | #210 | Tragic 63.8% |
Demographics Similar to Italians by Family Households
In terms of family households, the demographic groups most similar to Italians are Immigrants from Panama (64.8%, a difference of 0.010%), Panamanian (64.8%, a difference of 0.020%), Immigrants from Ecuador (64.8%, a difference of 0.020%), Immigrants from Argentina (64.9%, a difference of 0.040%), and Immigrants from Belize (64.9%, a difference of 0.040%).
| Demographics | Rating | Rank | Family Households |
| Hungarians | 94.0 /100 | #121 | Exceptional 64.9% |
| Hmong | 93.4 /100 | #122 | Exceptional 64.9% |
| Choctaw | 93.4 /100 | #123 | Exceptional 64.9% |
| Immigrants | Argentina | 92.8 /100 | #124 | Exceptional 64.9% |
| Immigrants | Belize | 92.7 /100 | #125 | Exceptional 64.9% |
| Panamanians | 92.4 /100 | #126 | Exceptional 64.8% |
| Immigrants | Panama | 92.0 /100 | #127 | Exceptional 64.8% |
| Italians | 91.9 /100 | #128 | Exceptional 64.8% |
| Immigrants | Ecuador | 91.4 /100 | #129 | Exceptional 64.8% |
| Immigrants | Italy | 90.2 /100 | #130 | Exceptional 64.8% |
| Immigrants | Nonimmigrants | 90.1 /100 | #131 | Exceptional 64.8% |
| Cajuns | 89.4 /100 | #132 | Excellent 64.8% |
| Belizeans | 89.3 /100 | #133 | Excellent 64.8% |
| Greeks | 88.1 /100 | #134 | Excellent 64.7% |
| Maltese | 87.4 /100 | #135 | Excellent 64.7% |