Puerto Rican vs Carpatho Rusyn Family Households
COMPARE
Puerto Rican
Carpatho Rusyn
Family Households
Family Households Comparison
Puerto Ricans
Carpatho Rusyns
64.2%
FAMILY HOUSEHOLDS
33.4/ 100
METRIC RATING
184th/ 347
METRIC RANK
61.1%
FAMILY HOUSEHOLDS
0.0/ 100
METRIC RATING
335th/ 347
METRIC RANK
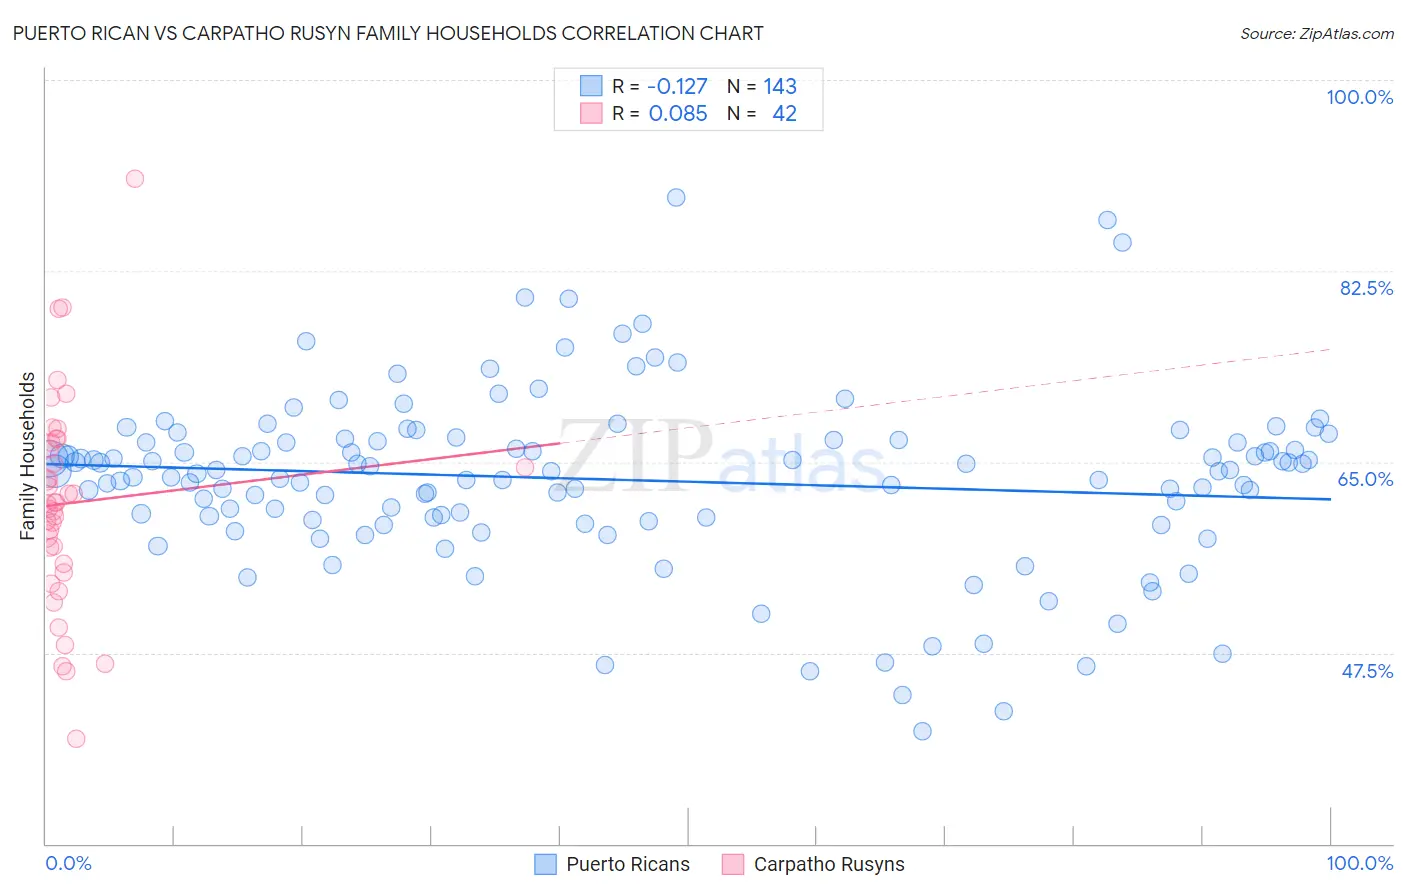
Puerto Rican vs Carpatho Rusyn Family Households Correlation Chart
The statistical analysis conducted on geographies consisting of 527,724,488 people shows a poor negative correlation between the proportion of Puerto Ricans and percentage of family households in the United States with a correlation coefficient (R) of -0.127 and weighted average of 64.2%. Similarly, the statistical analysis conducted on geographies consisting of 58,871,690 people shows a slight positive correlation between the proportion of Carpatho Rusyns and percentage of family households in the United States with a correlation coefficient (R) of 0.085 and weighted average of 61.1%, a difference of 5.0%.
Family Households Correlation Summary
| Measurement | Puerto Rican | Carpatho Rusyn |
| Minimum | 40.3% | 39.6% |
| Maximum | 89.2% | 91.0% |
| Range | 48.9% | 51.3% |
| Mean | 63.4% | 61.2% |
| Median | 64.2% | 61.2% |
| Interquartile 25% (IQ1) | 59.9% | 55.7% |
| Interquartile 75% (IQ3) | 67.0% | 66.8% |
| Interquartile Range (IQR) | 7.1% | 11.1% |
| Standard Deviation (Sample) | 8.0% | 9.7% |
| Standard Deviation (Population) | 8.0% | 9.6% |
Similar Demographics by Family Households
Demographics Similar to Puerto Ricans by Family Households
In terms of family households, the demographic groups most similar to Puerto Ricans are Creek (64.2%, a difference of 0.010%), Immigrants from Honduras (64.2%, a difference of 0.020%), Immigrants from Trinidad and Tobago (64.2%, a difference of 0.020%), Ukrainian (64.2%, a difference of 0.020%), and Immigrants from Iran (64.1%, a difference of 0.050%).
| Demographics | Rating | Rank | Family Households |
| Immigrants | Micronesia | 42.3 /100 | #177 | Average 64.2% |
| Jamaicans | 40.6 /100 | #178 | Average 64.2% |
| Immigrants | Ukraine | 38.2 /100 | #179 | Fair 64.2% |
| Immigrants | Honduras | 35.0 /100 | #180 | Fair 64.2% |
| Immigrants | Trinidad and Tobago | 34.9 /100 | #181 | Fair 64.2% |
| Ukrainians | 34.6 /100 | #182 | Fair 64.2% |
| Creek | 34.1 /100 | #183 | Fair 64.2% |
| Puerto Ricans | 33.4 /100 | #184 | Fair 64.2% |
| Immigrants | Iran | 30.4 /100 | #185 | Fair 64.1% |
| Spanish Americans | 30.1 /100 | #186 | Fair 64.1% |
| Northern Europeans | 28.2 /100 | #187 | Fair 64.1% |
| Paraguayans | 26.7 /100 | #188 | Fair 64.1% |
| Immigrants | Western Asia | 25.3 /100 | #189 | Fair 64.1% |
| Zimbabweans | 24.7 /100 | #190 | Fair 64.1% |
| Arabs | 24.5 /100 | #191 | Fair 64.1% |
Demographics Similar to Carpatho Rusyns by Family Households
In terms of family households, the demographic groups most similar to Carpatho Rusyns are Immigrants from Eastern Africa (61.1%, a difference of 0.12%), Immigrants from Ethiopia (61.2%, a difference of 0.20%), Ethiopian (61.2%, a difference of 0.28%), German Russian (60.9%, a difference of 0.28%), and Soviet Union (60.9%, a difference of 0.28%).
| Demographics | Rating | Rank | Family Households |
| Kiowa | 0.0 /100 | #328 | Tragic 61.4% |
| Cambodians | 0.0 /100 | #329 | Tragic 61.4% |
| Immigrants | Australia | 0.0 /100 | #330 | Tragic 61.3% |
| Immigrants | France | 0.0 /100 | #331 | Tragic 61.3% |
| Ethiopians | 0.0 /100 | #332 | Tragic 61.2% |
| Immigrants | Ethiopia | 0.0 /100 | #333 | Tragic 61.2% |
| Immigrants | Eastern Africa | 0.0 /100 | #334 | Tragic 61.1% |
| Carpatho Rusyns | 0.0 /100 | #335 | Tragic 61.1% |
| German Russians | 0.0 /100 | #336 | Tragic 60.9% |
| Soviet Union | 0.0 /100 | #337 | Tragic 60.9% |
| Immigrants | Eritrea | 0.0 /100 | #338 | Tragic 60.8% |
| Immigrants | Saudi Arabia | 0.0 /100 | #339 | Tragic 60.7% |
| Immigrants | Sudan | 0.0 /100 | #340 | Tragic 60.2% |
| Immigrants | Senegal | 0.0 /100 | #341 | Tragic 60.1% |
| Sudanese | 0.0 /100 | #342 | Tragic 60.0% |