Osage vs Italian Family Households
COMPARE
Osage
Italian
Family Households
Family Households Comparison
Osage
Italians
63.7%
FAMILY HOUSEHOLDS
7.0/ 100
METRIC RATING
217th/ 347
METRIC RANK
64.8%
FAMILY HOUSEHOLDS
91.9/ 100
METRIC RATING
128th/ 347
METRIC RANK
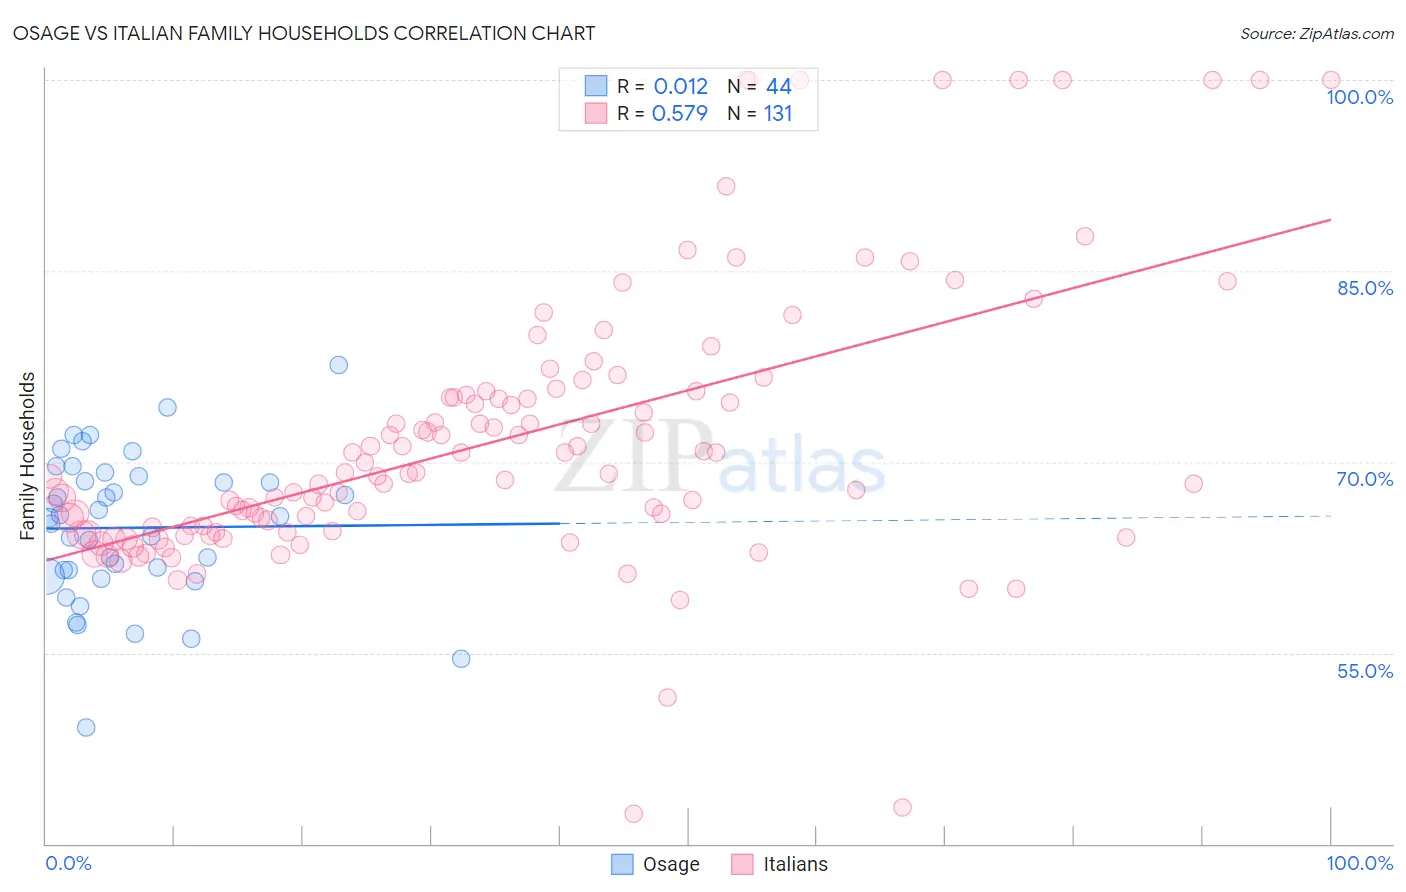
Osage vs Italian Family Households Correlation Chart
The statistical analysis conducted on geographies consisting of 91,796,062 people shows no correlation between the proportion of Osage and percentage of family households in the United States with a correlation coefficient (R) of 0.012 and weighted average of 63.7%. Similarly, the statistical analysis conducted on geographies consisting of 574,452,488 people shows a substantial positive correlation between the proportion of Italians and percentage of family households in the United States with a correlation coefficient (R) of 0.579 and weighted average of 64.8%, a difference of 1.7%.
Family Households Correlation Summary
| Measurement | Osage | Italian |
| Minimum | 49.2% | 42.4% |
| Maximum | 77.6% | 100.0% |
| Range | 28.5% | 57.6% |
| Mean | 64.8% | 71.7% |
| Median | 65.7% | 69.1% |
| Interquartile 25% (IQ1) | 61.3% | 64.5% |
| Interquartile 75% (IQ3) | 68.7% | 75.2% |
| Interquartile Range (IQR) | 7.4% | 10.7% |
| Standard Deviation (Sample) | 5.7% | 10.9% |
| Standard Deviation (Population) | 5.7% | 10.8% |
Similar Demographics by Family Households
Demographics Similar to Osage by Family Households
In terms of family households, the demographic groups most similar to Osage are Marshallese (63.7%, a difference of 0.0%), Croatian (63.8%, a difference of 0.010%), Belgian (63.8%, a difference of 0.030%), Macedonian (63.7%, a difference of 0.030%), and Immigrants from Europe (63.7%, a difference of 0.030%).
| Demographics | Rating | Rank | Family Households |
| Immigrants | Thailand | 9.6 /100 | #210 | Tragic 63.8% |
| Shoshone | 9.4 /100 | #211 | Tragic 63.8% |
| Immigrants | Netherlands | 9.4 /100 | #212 | Tragic 63.8% |
| Immigrants | Northern Europe | 8.8 /100 | #213 | Tragic 63.8% |
| Celtics | 8.0 /100 | #214 | Tragic 63.8% |
| Belgians | 7.6 /100 | #215 | Tragic 63.8% |
| Croatians | 7.3 /100 | #216 | Tragic 63.8% |
| Osage | 7.0 /100 | #217 | Tragic 63.7% |
| Marshallese | 6.9 /100 | #218 | Tragic 63.7% |
| Macedonians | 6.5 /100 | #219 | Tragic 63.7% |
| Immigrants | Europe | 6.4 /100 | #220 | Tragic 63.7% |
| Immigrants | South Africa | 5.9 /100 | #221 | Tragic 63.7% |
| Immigrants | Belarus | 5.5 /100 | #222 | Tragic 63.7% |
| French Canadians | 5.4 /100 | #223 | Tragic 63.7% |
| Turks | 4.5 /100 | #224 | Tragic 63.6% |
Demographics Similar to Italians by Family Households
In terms of family households, the demographic groups most similar to Italians are Immigrants from Panama (64.8%, a difference of 0.010%), Panamanian (64.8%, a difference of 0.020%), Immigrants from Ecuador (64.8%, a difference of 0.020%), Immigrants from Argentina (64.9%, a difference of 0.040%), and Immigrants from Belize (64.9%, a difference of 0.040%).
| Demographics | Rating | Rank | Family Households |
| Hungarians | 94.0 /100 | #121 | Exceptional 64.9% |
| Hmong | 93.4 /100 | #122 | Exceptional 64.9% |
| Choctaw | 93.4 /100 | #123 | Exceptional 64.9% |
| Immigrants | Argentina | 92.8 /100 | #124 | Exceptional 64.9% |
| Immigrants | Belize | 92.7 /100 | #125 | Exceptional 64.9% |
| Panamanians | 92.4 /100 | #126 | Exceptional 64.8% |
| Immigrants | Panama | 92.0 /100 | #127 | Exceptional 64.8% |
| Italians | 91.9 /100 | #128 | Exceptional 64.8% |
| Immigrants | Ecuador | 91.4 /100 | #129 | Exceptional 64.8% |
| Immigrants | Italy | 90.2 /100 | #130 | Exceptional 64.8% |
| Immigrants | Nonimmigrants | 90.1 /100 | #131 | Exceptional 64.8% |
| Cajuns | 89.4 /100 | #132 | Excellent 64.8% |
| Belizeans | 89.3 /100 | #133 | Excellent 64.8% |
| Greeks | 88.1 /100 | #134 | Excellent 64.7% |
| Maltese | 87.4 /100 | #135 | Excellent 64.7% |