Potawatomi vs Crow Births to Unmarried Women
COMPARE
Potawatomi
Crow
Births to Unmarried Women
Births to Unmarried Women Comparison
Potawatomi
Crow
36.2%
BIRTHS TO UNMARRIED WOMEN
0.2/ 100
METRIC RATING
254th/ 347
METRIC RANK
40.4%
BIRTHS TO UNMARRIED WOMEN
0.0/ 100
METRIC RATING
320th/ 347
METRIC RANK
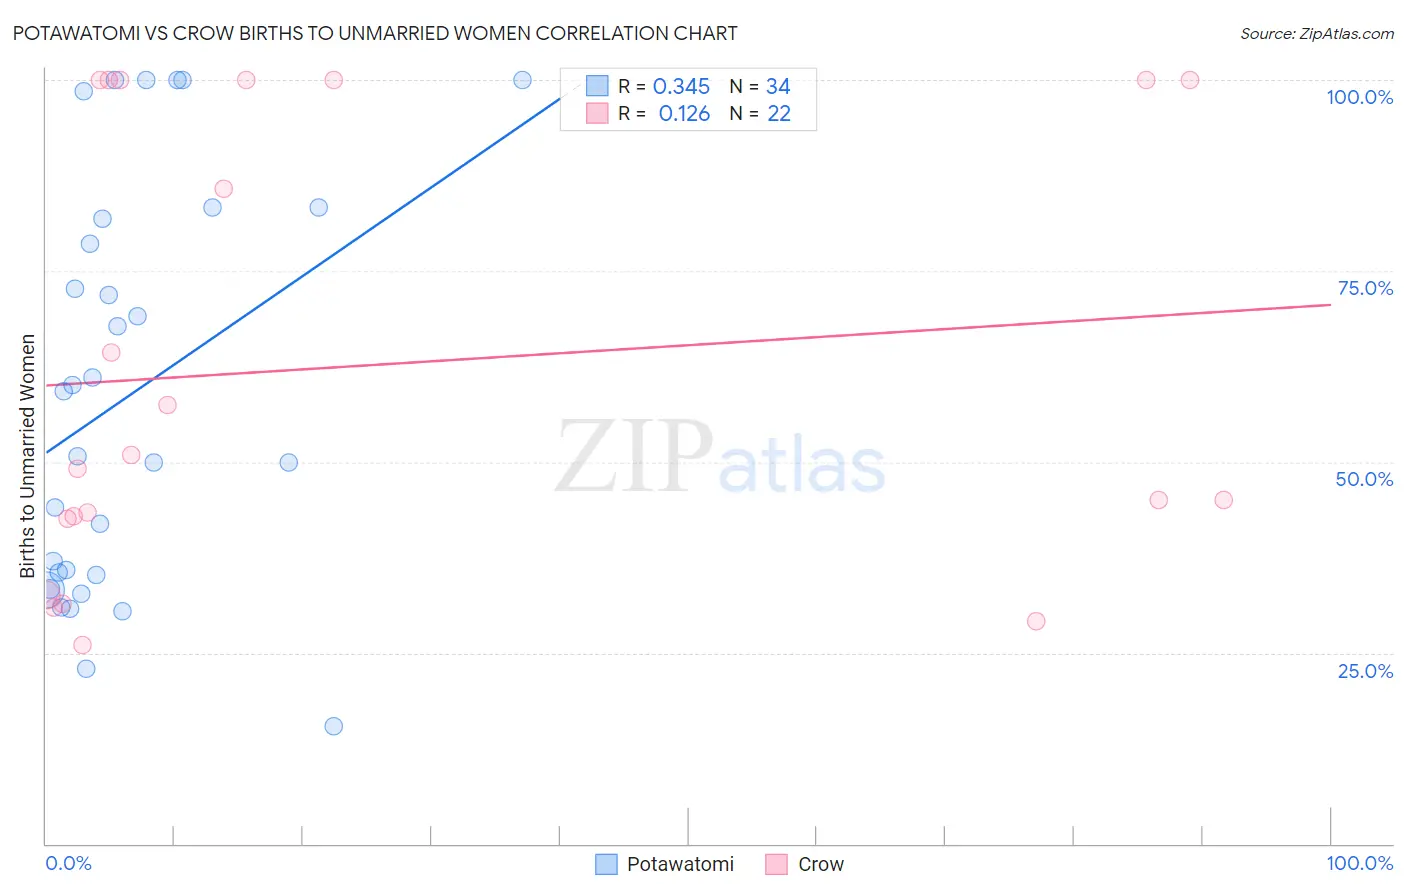
Potawatomi vs Crow Births to Unmarried Women Correlation Chart
The statistical analysis conducted on geographies consisting of 115,144,895 people shows a mild positive correlation between the proportion of Potawatomi and percentage of births to unmarried women in the United States with a correlation coefficient (R) of 0.345 and weighted average of 36.2%. Similarly, the statistical analysis conducted on geographies consisting of 58,263,233 people shows a poor positive correlation between the proportion of Crow and percentage of births to unmarried women in the United States with a correlation coefficient (R) of 0.126 and weighted average of 40.4%, a difference of 11.4%.
Births to Unmarried Women Correlation Summary
| Measurement | Potawatomi | Crow |
| Minimum | 15.4% | 26.1% |
| Maximum | 100.0% | 100.0% |
| Range | 84.6% | 73.9% |
| Mean | 58.7% | 62.6% |
| Median | 55.0% | 50.0% |
| Interquartile 25% (IQ1) | 35.2% | 42.5% |
| Interquartile 75% (IQ3) | 81.8% | 100.0% |
| Interquartile Range (IQR) | 46.6% | 57.5% |
| Standard Deviation (Sample) | 26.4% | 29.1% |
| Standard Deviation (Population) | 26.1% | 28.4% |
Similar Demographics by Births to Unmarried Women
Demographics Similar to Potawatomi by Births to Unmarried Women
In terms of births to unmarried women, the demographic groups most similar to Potawatomi are Chickasaw (36.3%, a difference of 0.14%), Immigrants from Trinidad and Tobago (36.3%, a difference of 0.14%), Immigrants from Grenada (36.3%, a difference of 0.16%), Immigrants from Portugal (36.2%, a difference of 0.22%), and American (36.4%, a difference of 0.45%).
| Demographics | Rating | Rank | Births to Unmarried Women |
| Immigrants | Nigeria | 0.7 /100 | #247 | Tragic 35.4% |
| Immigrants | Nonimmigrants | 0.6 /100 | #248 | Tragic 35.5% |
| Bermudans | 0.6 /100 | #249 | Tragic 35.5% |
| Mexican American Indians | 0.4 /100 | #250 | Tragic 35.7% |
| Immigrants | Western Africa | 0.3 /100 | #251 | Tragic 36.0% |
| Salvadorans | 0.3 /100 | #252 | Tragic 36.0% |
| Immigrants | Portugal | 0.2 /100 | #253 | Tragic 36.2% |
| Potawatomi | 0.2 /100 | #254 | Tragic 36.2% |
| Chickasaw | 0.2 /100 | #255 | Tragic 36.3% |
| Immigrants | Trinidad and Tobago | 0.2 /100 | #256 | Tragic 36.3% |
| Immigrants | Grenada | 0.2 /100 | #257 | Tragic 36.3% |
| Americans | 0.2 /100 | #258 | Tragic 36.4% |
| Immigrants | El Salvador | 0.2 /100 | #259 | Tragic 36.4% |
| Ottawa | 0.2 /100 | #260 | Tragic 36.5% |
| Trinidadians and Tobagonians | 0.2 /100 | #261 | Tragic 36.5% |
Demographics Similar to Crow by Births to Unmarried Women
In terms of births to unmarried women, the demographic groups most similar to Crow are Yakama (40.3%, a difference of 0.060%), Immigrants from Bahamas (40.1%, a difference of 0.61%), Immigrants from Dominican Republic (40.1%, a difference of 0.68%), Bahamian (40.8%, a difference of 1.0%), and Apache (39.9%, a difference of 1.2%).
| Demographics | Rating | Rank | Births to Unmarried Women |
| Africans | 0.0 /100 | #313 | Tragic 39.7% |
| Immigrants | Caribbean | 0.0 /100 | #314 | Tragic 39.8% |
| Dominicans | 0.0 /100 | #315 | Tragic 39.8% |
| Apache | 0.0 /100 | #316 | Tragic 39.9% |
| Immigrants | Dominican Republic | 0.0 /100 | #317 | Tragic 40.1% |
| Immigrants | Bahamas | 0.0 /100 | #318 | Tragic 40.1% |
| Yakama | 0.0 /100 | #319 | Tragic 40.3% |
| Crow | 0.0 /100 | #320 | Tragic 40.4% |
| Bahamians | 0.0 /100 | #321 | Tragic 40.8% |
| Cajuns | 0.0 /100 | #322 | Tragic 41.0% |
| Sioux | 0.0 /100 | #323 | Tragic 41.0% |
| Cape Verdeans | 0.0 /100 | #324 | Tragic 41.3% |
| Cheyenne | 0.0 /100 | #325 | Tragic 41.3% |
| Immigrants | Cuba | 0.0 /100 | #326 | Tragic 41.5% |
| Tsimshian | 0.0 /100 | #327 | Tragic 42.2% |