Potawatomi vs Mexican Births to Unmarried Women
COMPARE
Potawatomi
Mexican
Births to Unmarried Women
Births to Unmarried Women Comparison
Potawatomi
Mexicans
36.2%
BIRTHS TO UNMARRIED WOMEN
0.2/ 100
METRIC RATING
254th/ 347
METRIC RANK
36.9%
BIRTHS TO UNMARRIED WOMEN
0.1/ 100
METRIC RATING
273rd/ 347
METRIC RANK
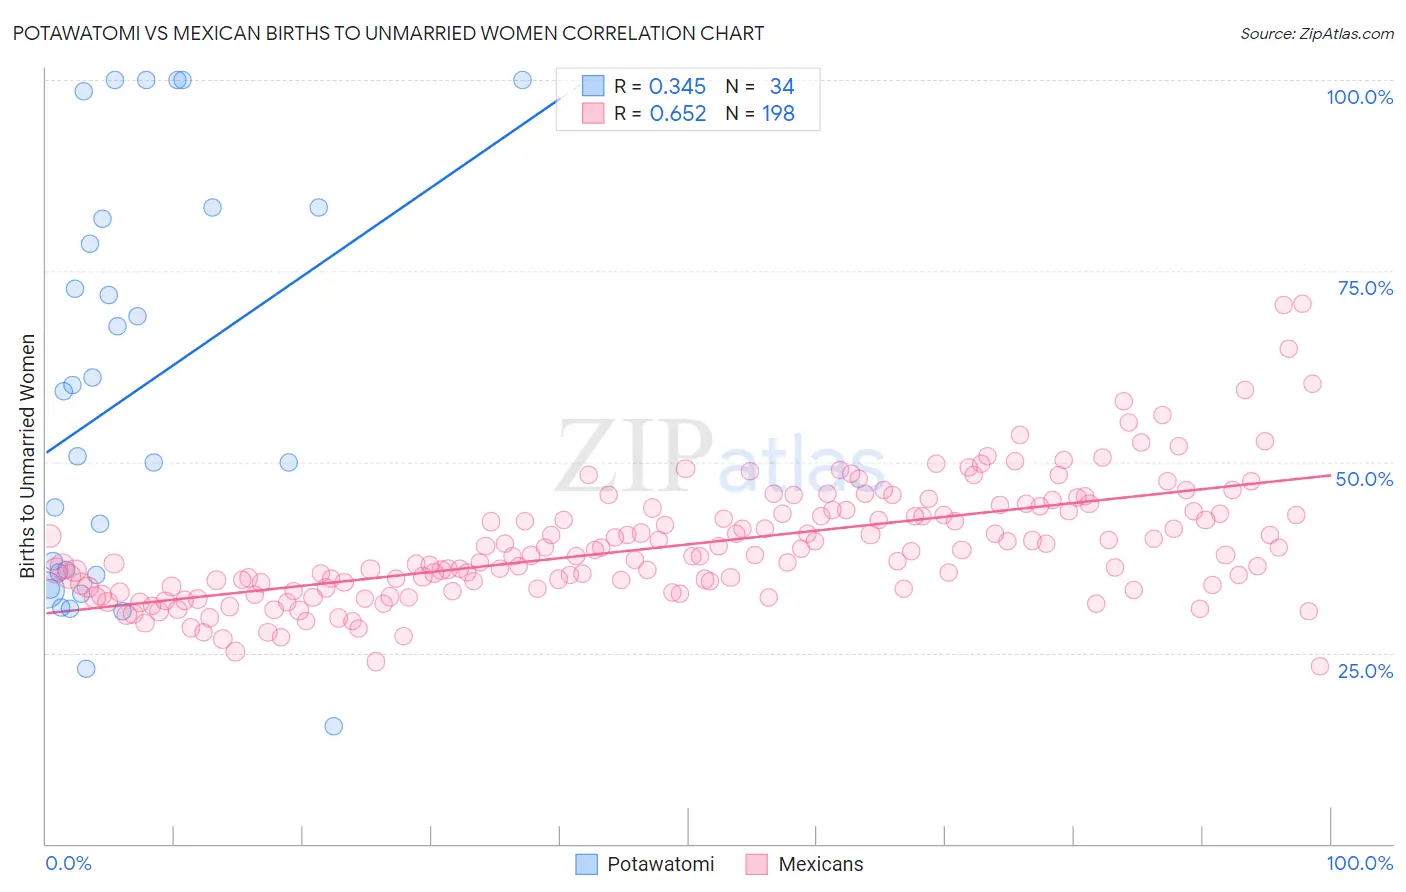
Potawatomi vs Mexican Births to Unmarried Women Correlation Chart
The statistical analysis conducted on geographies consisting of 115,144,895 people shows a mild positive correlation between the proportion of Potawatomi and percentage of births to unmarried women in the United States with a correlation coefficient (R) of 0.345 and weighted average of 36.2%. Similarly, the statistical analysis conducted on geographies consisting of 505,082,784 people shows a significant positive correlation between the proportion of Mexicans and percentage of births to unmarried women in the United States with a correlation coefficient (R) of 0.652 and weighted average of 36.9%, a difference of 1.9%.
Births to Unmarried Women Correlation Summary
| Measurement | Potawatomi | Mexican |
| Minimum | 15.4% | 23.3% |
| Maximum | 100.0% | 70.7% |
| Range | 84.6% | 47.4% |
| Mean | 58.7% | 39.1% |
| Median | 55.0% | 37.7% |
| Interquartile 25% (IQ1) | 35.2% | 33.5% |
| Interquartile 75% (IQ3) | 81.8% | 43.6% |
| Interquartile Range (IQR) | 46.6% | 10.1% |
| Standard Deviation (Sample) | 26.4% | 8.0% |
| Standard Deviation (Population) | 26.1% | 7.9% |
Demographics Similar to Potawatomi and Mexicans by Births to Unmarried Women
In terms of births to unmarried women, the demographic groups most similar to Potawatomi are Chickasaw (36.3%, a difference of 0.14%), Immigrants from Trinidad and Tobago (36.3%, a difference of 0.14%), Immigrants from Grenada (36.3%, a difference of 0.16%), Immigrants from Portugal (36.2%, a difference of 0.22%), and American (36.4%, a difference of 0.45%). Similarly, the demographic groups most similar to Mexicans are Choctaw (36.9%, a difference of 0.12%), Immigrants from Barbados (36.8%, a difference of 0.33%), Immigrants from Congo (36.8%, a difference of 0.36%), Senegalese (36.8%, a difference of 0.44%), and Comanche (36.7%, a difference of 0.56%).
| Demographics | Rating | Rank | Births to Unmarried Women |
| Immigrants | Portugal | 0.2 /100 | #253 | Tragic 36.2% |
| Potawatomi | 0.2 /100 | #254 | Tragic 36.2% |
| Chickasaw | 0.2 /100 | #255 | Tragic 36.3% |
| Immigrants | Trinidad and Tobago | 0.2 /100 | #256 | Tragic 36.3% |
| Immigrants | Grenada | 0.2 /100 | #257 | Tragic 36.3% |
| Americans | 0.2 /100 | #258 | Tragic 36.4% |
| Immigrants | El Salvador | 0.2 /100 | #259 | Tragic 36.4% |
| Ottawa | 0.2 /100 | #260 | Tragic 36.5% |
| Trinidadians and Tobagonians | 0.2 /100 | #261 | Tragic 36.5% |
| French American Indians | 0.1 /100 | #262 | Tragic 36.6% |
| Nicaraguans | 0.1 /100 | #263 | Tragic 36.6% |
| Sub-Saharan Africans | 0.1 /100 | #264 | Tragic 36.7% |
| Cherokee | 0.1 /100 | #265 | Tragic 36.7% |
| Immigrants | Senegal | 0.1 /100 | #266 | Tragic 36.7% |
| Central Americans | 0.1 /100 | #267 | Tragic 36.7% |
| Comanche | 0.1 /100 | #268 | Tragic 36.7% |
| Senegalese | 0.1 /100 | #269 | Tragic 36.8% |
| Immigrants | Congo | 0.1 /100 | #270 | Tragic 36.8% |
| Immigrants | Barbados | 0.1 /100 | #271 | Tragic 36.8% |
| Choctaw | 0.1 /100 | #272 | Tragic 36.9% |
| Mexicans | 0.1 /100 | #273 | Tragic 36.9% |