Apache vs Crow Births to Unmarried Women
COMPARE
Apache
Crow
Births to Unmarried Women
Births to Unmarried Women Comparison
Apache
Crow
39.9%
BIRTHS TO UNMARRIED WOMEN
0.0/ 100
METRIC RATING
316th/ 347
METRIC RANK
40.4%
BIRTHS TO UNMARRIED WOMEN
0.0/ 100
METRIC RATING
320th/ 347
METRIC RANK
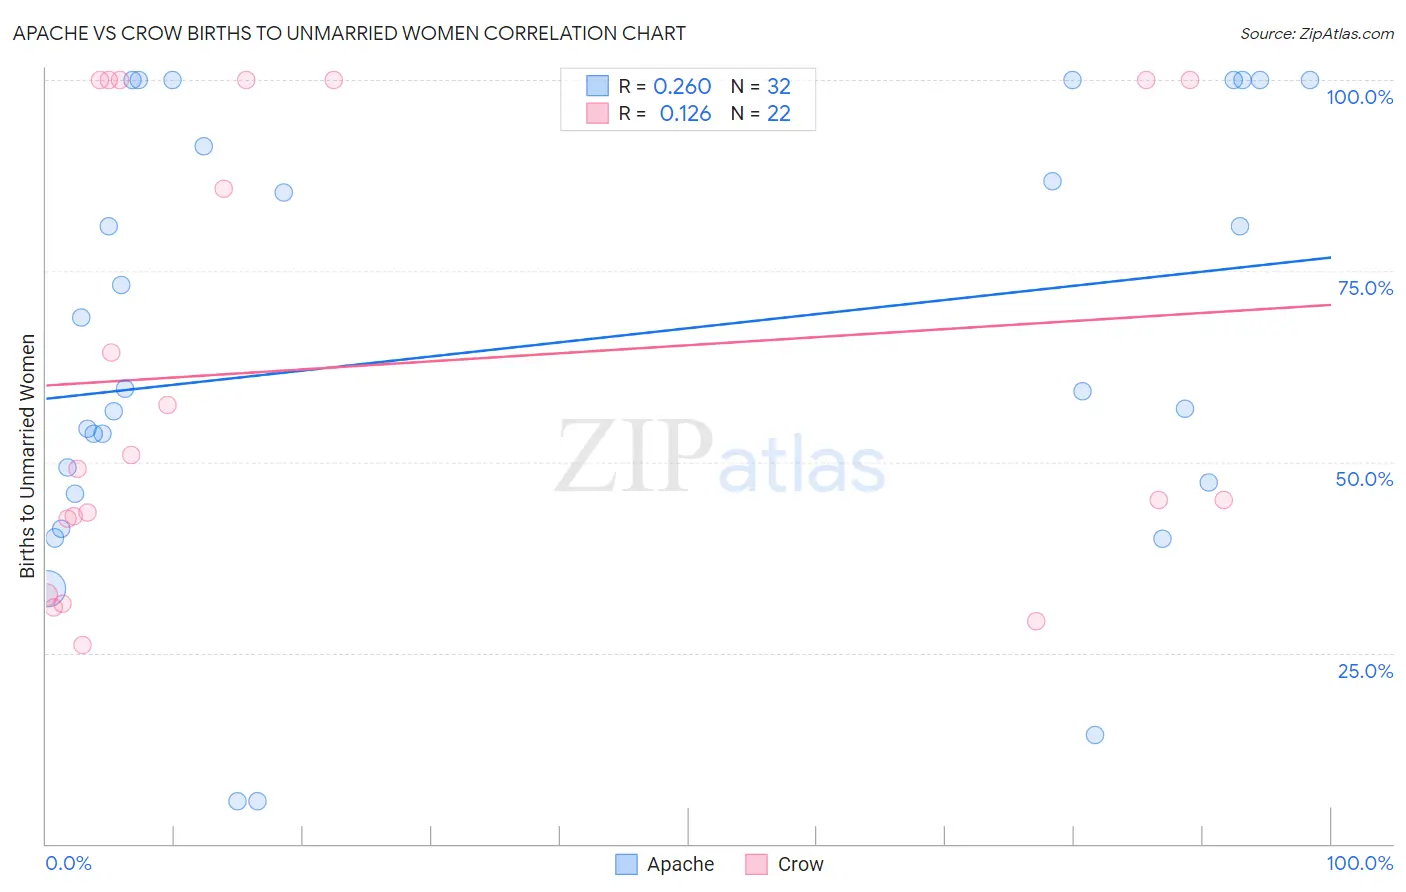
Apache vs Crow Births to Unmarried Women Correlation Chart
The statistical analysis conducted on geographies consisting of 223,899,769 people shows a weak positive correlation between the proportion of Apache and percentage of births to unmarried women in the United States with a correlation coefficient (R) of 0.260 and weighted average of 39.9%. Similarly, the statistical analysis conducted on geographies consisting of 58,263,233 people shows a poor positive correlation between the proportion of Crow and percentage of births to unmarried women in the United States with a correlation coefficient (R) of 0.126 and weighted average of 40.4%, a difference of 1.2%.
Births to Unmarried Women Correlation Summary
| Measurement | Apache | Crow |
| Minimum | 5.6% | 26.1% |
| Maximum | 100.0% | 100.0% |
| Range | 94.4% | 73.9% |
| Mean | 65.1% | 62.6% |
| Median | 59.4% | 50.0% |
| Interquartile 25% (IQ1) | 46.6% | 42.5% |
| Interquartile 75% (IQ3) | 95.7% | 100.0% |
| Interquartile Range (IQR) | 49.1% | 57.5% |
| Standard Deviation (Sample) | 28.9% | 29.1% |
| Standard Deviation (Population) | 28.4% | 28.4% |
Demographics Similar to Apache and Crow by Births to Unmarried Women
In terms of births to unmarried women, the demographic groups most similar to Apache are Dominican (39.8%, a difference of 0.060%), Immigrants from Caribbean (39.8%, a difference of 0.10%), African (39.7%, a difference of 0.38%), Immigrants from Dominican Republic (40.1%, a difference of 0.55%), and Immigrants from Bahamas (40.1%, a difference of 0.62%). Similarly, the demographic groups most similar to Crow are Yakama (40.3%, a difference of 0.060%), Immigrants from Bahamas (40.1%, a difference of 0.61%), Immigrants from Dominican Republic (40.1%, a difference of 0.68%), Bahamian (40.8%, a difference of 1.0%), and Dominican (39.8%, a difference of 1.3%).
| Demographics | Rating | Rank | Births to Unmarried Women |
| Aleuts | 0.0 /100 | #308 | Tragic 39.3% |
| Cubans | 0.0 /100 | #309 | Tragic 39.4% |
| Immigrants | Dominica | 0.0 /100 | #310 | Tragic 39.5% |
| Immigrants | Azores | 0.0 /100 | #311 | Tragic 39.6% |
| U.S. Virgin Islanders | 0.0 /100 | #312 | Tragic 39.6% |
| Africans | 0.0 /100 | #313 | Tragic 39.7% |
| Immigrants | Caribbean | 0.0 /100 | #314 | Tragic 39.8% |
| Dominicans | 0.0 /100 | #315 | Tragic 39.8% |
| Apache | 0.0 /100 | #316 | Tragic 39.9% |
| Immigrants | Dominican Republic | 0.0 /100 | #317 | Tragic 40.1% |
| Immigrants | Bahamas | 0.0 /100 | #318 | Tragic 40.1% |
| Yakama | 0.0 /100 | #319 | Tragic 40.3% |
| Crow | 0.0 /100 | #320 | Tragic 40.4% |
| Bahamians | 0.0 /100 | #321 | Tragic 40.8% |
| Cajuns | 0.0 /100 | #322 | Tragic 41.0% |
| Sioux | 0.0 /100 | #323 | Tragic 41.0% |
| Cape Verdeans | 0.0 /100 | #324 | Tragic 41.3% |
| Cheyenne | 0.0 /100 | #325 | Tragic 41.3% |
| Immigrants | Cuba | 0.0 /100 | #326 | Tragic 41.5% |
| Tsimshian | 0.0 /100 | #327 | Tragic 42.2% |
| Immigrants | Cabo Verde | 0.0 /100 | #328 | Tragic 42.2% |