Potawatomi vs Crow Female Poverty Among 18-24 Year Olds
COMPARE
Potawatomi
Crow
Female Poverty Among 18-24 Year Olds
Female Poverty Among 18-24 Year Olds Comparison
Potawatomi
Crow
23.7%
FEMALE POVERTY AMONG 18-24 YEAR OLDS
0.0/ 100
METRIC RATING
311th/ 347
METRIC RANK
33.2%
FEMALE POVERTY AMONG 18-24 YEAR OLDS
0.0/ 100
METRIC RATING
347th/ 347
METRIC RANK
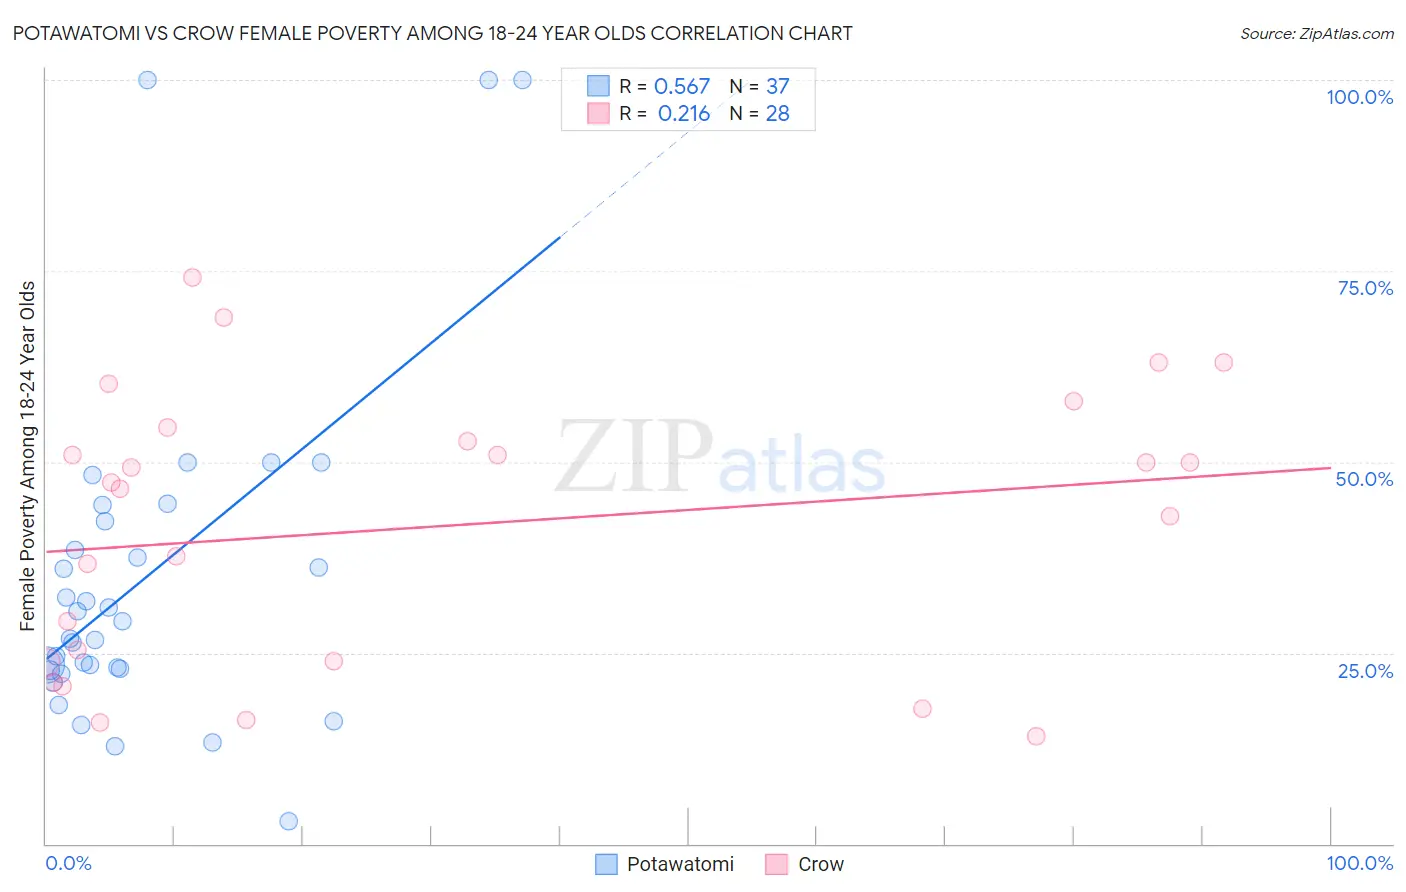
Potawatomi vs Crow Female Poverty Among 18-24 Year Olds Correlation Chart
The statistical analysis conducted on geographies consisting of 116,785,145 people shows a substantial positive correlation between the proportion of Potawatomi and poverty level among females between the ages 18 and 24 in the United States with a correlation coefficient (R) of 0.567 and weighted average of 23.7%. Similarly, the statistical analysis conducted on geographies consisting of 58,788,428 people shows a weak positive correlation between the proportion of Crow and poverty level among females between the ages 18 and 24 in the United States with a correlation coefficient (R) of 0.216 and weighted average of 33.2%, a difference of 40.2%.
Female Poverty Among 18-24 Year Olds Correlation Summary
| Measurement | Potawatomi | Crow |
| Minimum | 3.0% | 14.1% |
| Maximum | 100.0% | 74.1% |
| Range | 97.0% | 60.0% |
| Mean | 35.1% | 41.6% |
| Median | 29.2% | 46.8% |
| Interquartile 25% (IQ1) | 22.8% | 23.8% |
| Interquartile 75% (IQ3) | 43.3% | 53.6% |
| Interquartile Range (IQR) | 20.5% | 29.8% |
| Standard Deviation (Sample) | 22.6% | 17.9% |
| Standard Deviation (Population) | 22.3% | 17.6% |
Similar Demographics by Female Poverty Among 18-24 Year Olds
Demographics Similar to Potawatomi by Female Poverty Among 18-24 Year Olds
In terms of female poverty among 18-24 year olds, the demographic groups most similar to Potawatomi are Comanche (23.6%, a difference of 0.29%), Blackfeet (23.6%, a difference of 0.34%), Immigrants from Sudan (23.5%, a difference of 0.79%), Cree (23.4%, a difference of 1.1%), and Yuman (24.0%, a difference of 1.2%).
| Demographics | Rating | Rank | Female Poverty Among 18-24 Year Olds |
| Sudanese | 0.0 /100 | #304 | Tragic 23.0% |
| Immigrants | Kuwait | 0.0 /100 | #305 | Tragic 23.0% |
| Paiute | 0.0 /100 | #306 | Tragic 23.3% |
| Cree | 0.0 /100 | #307 | Tragic 23.4% |
| Immigrants | Sudan | 0.0 /100 | #308 | Tragic 23.5% |
| Blackfeet | 0.0 /100 | #309 | Tragic 23.6% |
| Comanche | 0.0 /100 | #310 | Tragic 23.6% |
| Potawatomi | 0.0 /100 | #311 | Tragic 23.7% |
| Yuman | 0.0 /100 | #312 | Tragic 24.0% |
| Creek | 0.0 /100 | #313 | Tragic 24.2% |
| Choctaw | 0.0 /100 | #314 | Tragic 24.3% |
| Blacks/African Americans | 0.0 /100 | #315 | Tragic 24.3% |
| Alsatians | 0.0 /100 | #316 | Tragic 24.4% |
| Osage | 0.0 /100 | #317 | Tragic 24.5% |
| Chickasaw | 0.0 /100 | #318 | Tragic 24.5% |
Demographics Similar to Crow by Female Poverty Among 18-24 Year Olds
In terms of female poverty among 18-24 year olds, the demographic groups most similar to Crow are Lumbee (31.1%, a difference of 7.0%), Tohono O'odham (31.0%, a difference of 7.1%), Navajo (30.3%, a difference of 9.6%), Puerto Rican (29.8%, a difference of 11.3%), and Kiowa (29.2%, a difference of 13.6%).
| Demographics | Rating | Rank | Female Poverty Among 18-24 Year Olds |
| Apache | 0.0 /100 | #333 | Tragic 26.3% |
| Pueblo | 0.0 /100 | #334 | Tragic 26.9% |
| Yup'ik | 0.0 /100 | #335 | Tragic 27.0% |
| Immigrants | Yemen | 0.0 /100 | #336 | Tragic 27.5% |
| Cheyenne | 0.0 /100 | #337 | Tragic 28.1% |
| Hopi | 0.0 /100 | #338 | Tragic 28.2% |
| Pima | 0.0 /100 | #339 | Tragic 28.4% |
| Sioux | 0.0 /100 | #340 | Tragic 28.6% |
| Colville | 0.0 /100 | #341 | Tragic 29.0% |
| Kiowa | 0.0 /100 | #342 | Tragic 29.2% |
| Puerto Ricans | 0.0 /100 | #343 | Tragic 29.8% |
| Navajo | 0.0 /100 | #344 | Tragic 30.3% |
| Tohono O'odham | 0.0 /100 | #345 | Tragic 31.0% |
| Lumbee | 0.0 /100 | #346 | Tragic 31.1% |
| Crow | 0.0 /100 | #347 | Tragic 33.2% |