Immigrants from Iraq vs Crow Births to Unmarried Women
COMPARE
Immigrants from Iraq
Crow
Births to Unmarried Women
Births to Unmarried Women Comparison
Immigrants from Iraq
Crow
27.1%
BIRTHS TO UNMARRIED WOMEN
99.8/ 100
METRIC RATING
31st/ 347
METRIC RANK
40.4%
BIRTHS TO UNMARRIED WOMEN
0.0/ 100
METRIC RATING
320th/ 347
METRIC RANK
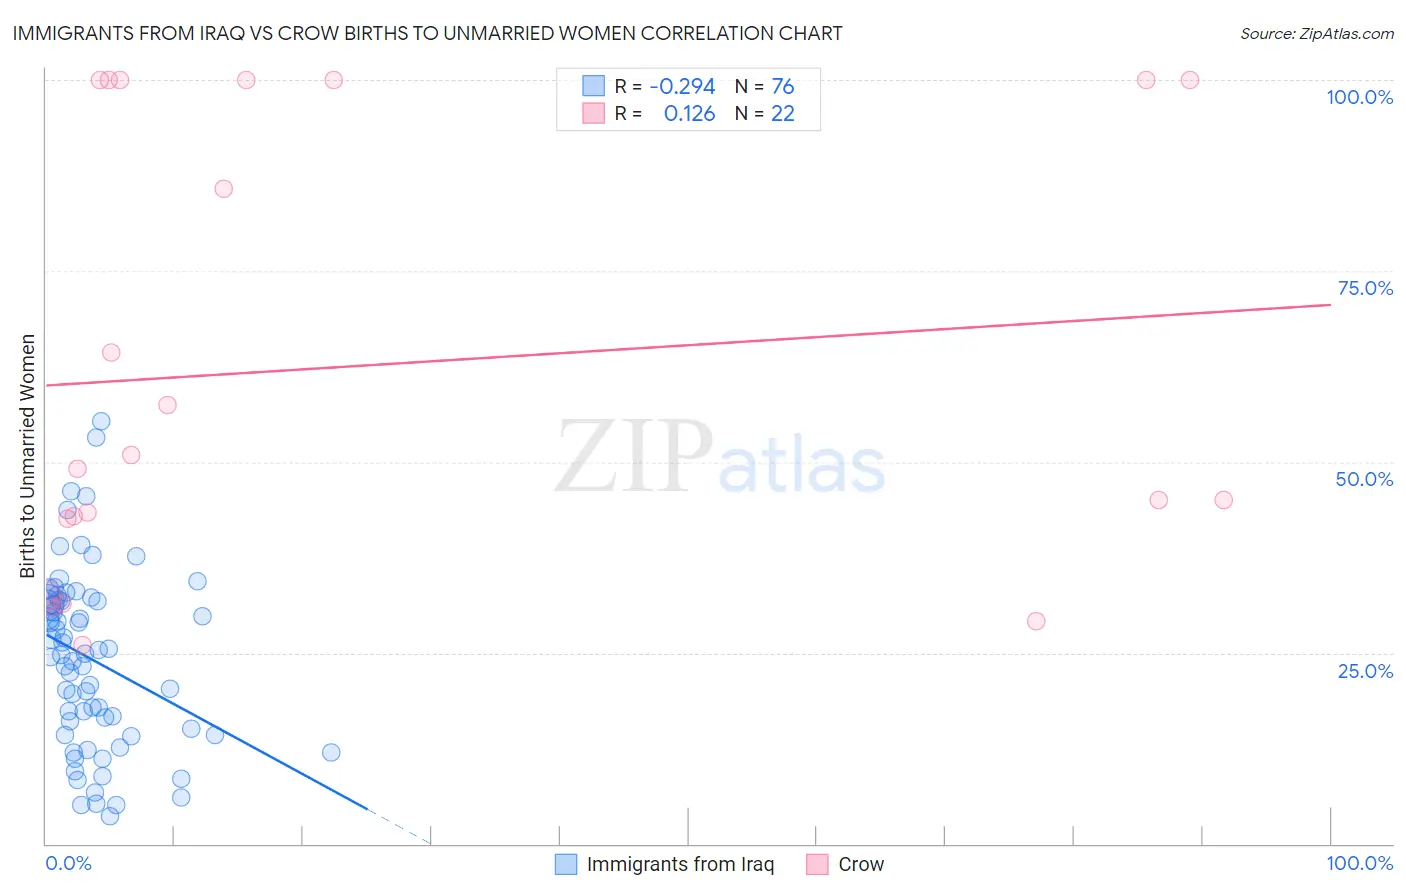
Immigrants from Iraq vs Crow Births to Unmarried Women Correlation Chart
The statistical analysis conducted on geographies consisting of 187,409,646 people shows a weak negative correlation between the proportion of Immigrants from Iraq and percentage of births to unmarried women in the United States with a correlation coefficient (R) of -0.294 and weighted average of 27.1%. Similarly, the statistical analysis conducted on geographies consisting of 58,263,233 people shows a poor positive correlation between the proportion of Crow and percentage of births to unmarried women in the United States with a correlation coefficient (R) of 0.126 and weighted average of 40.4%, a difference of 48.7%.
Births to Unmarried Women Correlation Summary
| Measurement | Immigrants from Iraq | Crow |
| Minimum | 3.6% | 26.1% |
| Maximum | 55.3% | 100.0% |
| Range | 51.7% | 73.9% |
| Mean | 24.1% | 62.6% |
| Median | 24.8% | 50.0% |
| Interquartile 25% (IQ1) | 14.6% | 42.5% |
| Interquartile 75% (IQ3) | 31.8% | 100.0% |
| Interquartile Range (IQR) | 17.1% | 57.5% |
| Standard Deviation (Sample) | 11.6% | 29.1% |
| Standard Deviation (Population) | 11.5% | 28.4% |
Similar Demographics by Births to Unmarried Women
Demographics Similar to Immigrants from Iraq by Births to Unmarried Women
In terms of births to unmarried women, the demographic groups most similar to Immigrants from Iraq are Immigrants from Russia (27.1%, a difference of 0.030%), Immigrants from Sri Lanka (27.2%, a difference of 0.10%), Immigrants from Pakistan (27.2%, a difference of 0.14%), Immigrants from Ireland (27.2%, a difference of 0.22%), and Bulgarian (27.1%, a difference of 0.29%).
| Demographics | Rating | Rank | Births to Unmarried Women |
| Immigrants | Australia | 99.9 /100 | #24 | Exceptional 26.6% |
| Cambodians | 99.9 /100 | #25 | Exceptional 26.7% |
| Asians | 99.9 /100 | #26 | Exceptional 26.8% |
| Immigrants | Asia | 99.9 /100 | #27 | Exceptional 26.8% |
| Okinawans | 99.8 /100 | #28 | Exceptional 26.9% |
| Cypriots | 99.8 /100 | #29 | Exceptional 27.0% |
| Bulgarians | 99.8 /100 | #30 | Exceptional 27.1% |
| Immigrants | Iraq | 99.8 /100 | #31 | Exceptional 27.1% |
| Immigrants | Russia | 99.8 /100 | #32 | Exceptional 27.1% |
| Immigrants | Sri Lanka | 99.8 /100 | #33 | Exceptional 27.2% |
| Immigrants | Pakistan | 99.8 /100 | #34 | Exceptional 27.2% |
| Immigrants | Ireland | 99.7 /100 | #35 | Exceptional 27.2% |
| Immigrants | Western Asia | 99.7 /100 | #36 | Exceptional 27.2% |
| Immigrants | Ukraine | 99.7 /100 | #37 | Exceptional 27.2% |
| Immigrants | Moldova | 99.7 /100 | #38 | Exceptional 27.3% |
Demographics Similar to Crow by Births to Unmarried Women
In terms of births to unmarried women, the demographic groups most similar to Crow are Yakama (40.3%, a difference of 0.060%), Immigrants from Bahamas (40.1%, a difference of 0.61%), Immigrants from Dominican Republic (40.1%, a difference of 0.68%), Bahamian (40.8%, a difference of 1.0%), and Apache (39.9%, a difference of 1.2%).
| Demographics | Rating | Rank | Births to Unmarried Women |
| Africans | 0.0 /100 | #313 | Tragic 39.7% |
| Immigrants | Caribbean | 0.0 /100 | #314 | Tragic 39.8% |
| Dominicans | 0.0 /100 | #315 | Tragic 39.8% |
| Apache | 0.0 /100 | #316 | Tragic 39.9% |
| Immigrants | Dominican Republic | 0.0 /100 | #317 | Tragic 40.1% |
| Immigrants | Bahamas | 0.0 /100 | #318 | Tragic 40.1% |
| Yakama | 0.0 /100 | #319 | Tragic 40.3% |
| Crow | 0.0 /100 | #320 | Tragic 40.4% |
| Bahamians | 0.0 /100 | #321 | Tragic 40.8% |
| Cajuns | 0.0 /100 | #322 | Tragic 41.0% |
| Sioux | 0.0 /100 | #323 | Tragic 41.0% |
| Cape Verdeans | 0.0 /100 | #324 | Tragic 41.3% |
| Cheyenne | 0.0 /100 | #325 | Tragic 41.3% |
| Immigrants | Cuba | 0.0 /100 | #326 | Tragic 41.5% |
| Tsimshian | 0.0 /100 | #327 | Tragic 42.2% |