Potawatomi vs Crow Cognitive Disability
COMPARE
Potawatomi
Crow
Cognitive Disability
Cognitive Disability Comparison
Potawatomi
Crow
18.0%
COGNITIVE DISABILITY
0.2/ 100
METRIC RATING
271st/ 347
METRIC RANK
17.3%
COGNITIVE DISABILITY
39.1/ 100
METRIC RATING
184th/ 347
METRIC RANK
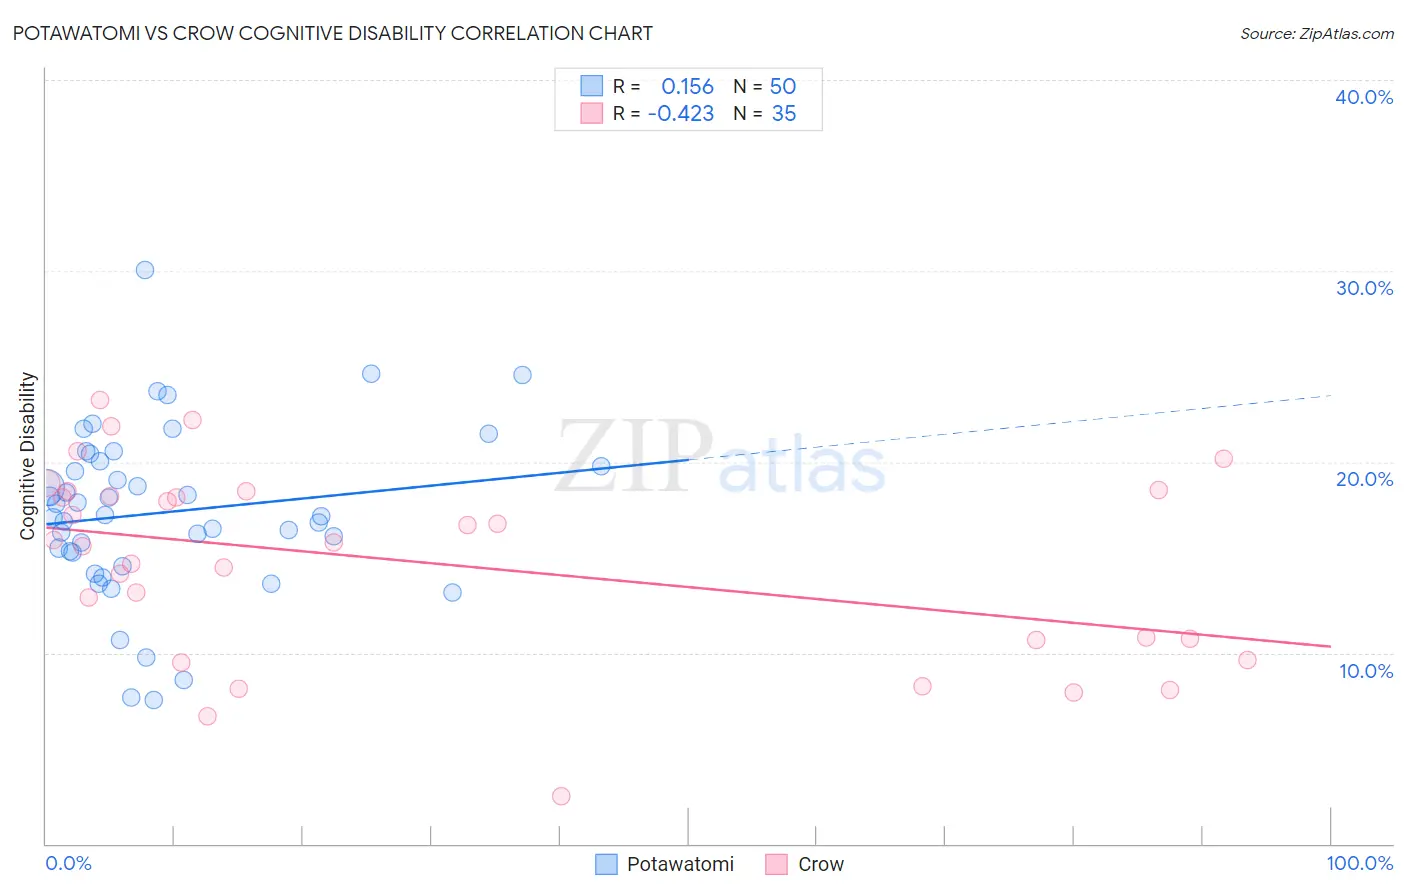
Potawatomi vs Crow Cognitive Disability Correlation Chart
The statistical analysis conducted on geographies consisting of 117,767,379 people shows a poor positive correlation between the proportion of Potawatomi and percentage of population with cognitive disability in the United States with a correlation coefficient (R) of 0.156 and weighted average of 18.0%. Similarly, the statistical analysis conducted on geographies consisting of 59,204,553 people shows a moderate negative correlation between the proportion of Crow and percentage of population with cognitive disability in the United States with a correlation coefficient (R) of -0.423 and weighted average of 17.3%, a difference of 4.0%.
Cognitive Disability Correlation Summary
| Measurement | Potawatomi | Crow |
| Minimum | 7.5% | 2.5% |
| Maximum | 30.0% | 23.2% |
| Range | 22.5% | 20.7% |
| Mean | 17.4% | 14.7% |
| Median | 17.2% | 15.8% |
| Interquartile 25% (IQ1) | 15.2% | 10.7% |
| Interquartile 75% (IQ3) | 20.0% | 18.5% |
| Interquartile Range (IQR) | 4.8% | 7.8% |
| Standard Deviation (Sample) | 4.4% | 5.0% |
| Standard Deviation (Population) | 4.4% | 5.0% |
Similar Demographics by Cognitive Disability
Demographics Similar to Potawatomi by Cognitive Disability
In terms of cognitive disability, the demographic groups most similar to Potawatomi are Immigrants from Honduras (18.0%, a difference of 0.010%), Immigrants from Bahamas (18.0%, a difference of 0.070%), Honduran (18.0%, a difference of 0.080%), Immigrants from Nepal (18.0%, a difference of 0.13%), and Immigrants from Nigeria (18.0%, a difference of 0.14%).
| Demographics | Rating | Rank | Cognitive Disability |
| Menominee | 0.4 /100 | #264 | Tragic 18.0% |
| Spanish Americans | 0.4 /100 | #265 | Tragic 18.0% |
| Belizeans | 0.4 /100 | #266 | Tragic 18.0% |
| Nepalese | 0.3 /100 | #267 | Tragic 18.0% |
| Cherokee | 0.3 /100 | #268 | Tragic 18.0% |
| Hondurans | 0.3 /100 | #269 | Tragic 18.0% |
| Immigrants | Bahamas | 0.3 /100 | #270 | Tragic 18.0% |
| Potawatomi | 0.2 /100 | #271 | Tragic 18.0% |
| Immigrants | Honduras | 0.2 /100 | #272 | Tragic 18.0% |
| Immigrants | Nepal | 0.2 /100 | #273 | Tragic 18.0% |
| Immigrants | Nigeria | 0.2 /100 | #274 | Tragic 18.0% |
| Immigrants | Laos | 0.2 /100 | #275 | Tragic 18.1% |
| Yuman | 0.2 /100 | #276 | Tragic 18.1% |
| Immigrants | Kuwait | 0.2 /100 | #277 | Tragic 18.1% |
| Immigrants | Micronesia | 0.2 /100 | #278 | Tragic 18.1% |
Demographics Similar to Crow by Cognitive Disability
In terms of cognitive disability, the demographic groups most similar to Crow are Afghan (17.3%, a difference of 0.030%), Spaniard (17.3%, a difference of 0.040%), Cambodian (17.3%, a difference of 0.10%), Immigrants from Guyana (17.3%, a difference of 0.11%), and Arab (17.3%, a difference of 0.11%).
| Demographics | Rating | Rank | Cognitive Disability |
| Ute | 49.1 /100 | #177 | Average 17.3% |
| Spanish | 48.9 /100 | #178 | Average 17.3% |
| Sioux | 48.6 /100 | #179 | Average 17.3% |
| Pakistanis | 43.9 /100 | #180 | Average 17.3% |
| Immigrants | Guyana | 42.9 /100 | #181 | Average 17.3% |
| Arabs | 42.8 /100 | #182 | Average 17.3% |
| Spaniards | 40.3 /100 | #183 | Average 17.3% |
| Crow | 39.1 /100 | #184 | Fair 17.3% |
| Afghans | 38.2 /100 | #185 | Fair 17.3% |
| Cambodians | 35.9 /100 | #186 | Fair 17.3% |
| Immigrants | Fiji | 33.7 /100 | #187 | Fair 17.4% |
| Immigrants | France | 29.8 /100 | #188 | Fair 17.4% |
| Immigrants | Western Asia | 29.5 /100 | #189 | Fair 17.4% |
| Immigrants | Spain | 27.7 /100 | #190 | Fair 17.4% |
| Immigrants | Nonimmigrants | 27.4 /100 | #191 | Fair 17.4% |