Hawaiian vs Immigrants from Guatemala Single Mother Households
COMPARE
Hawaiian
Immigrants from Guatemala
Single Mother Households
Single Mother Households Comparison
Hawaiians
Immigrants from Guatemala
6.6%
SINGLE MOTHER HOUSEHOLDS
16.1/ 100
METRIC RATING
198th/ 347
METRIC RANK
7.7%
SINGLE MOTHER HOUSEHOLDS
0.0/ 100
METRIC RATING
287th/ 347
METRIC RANK
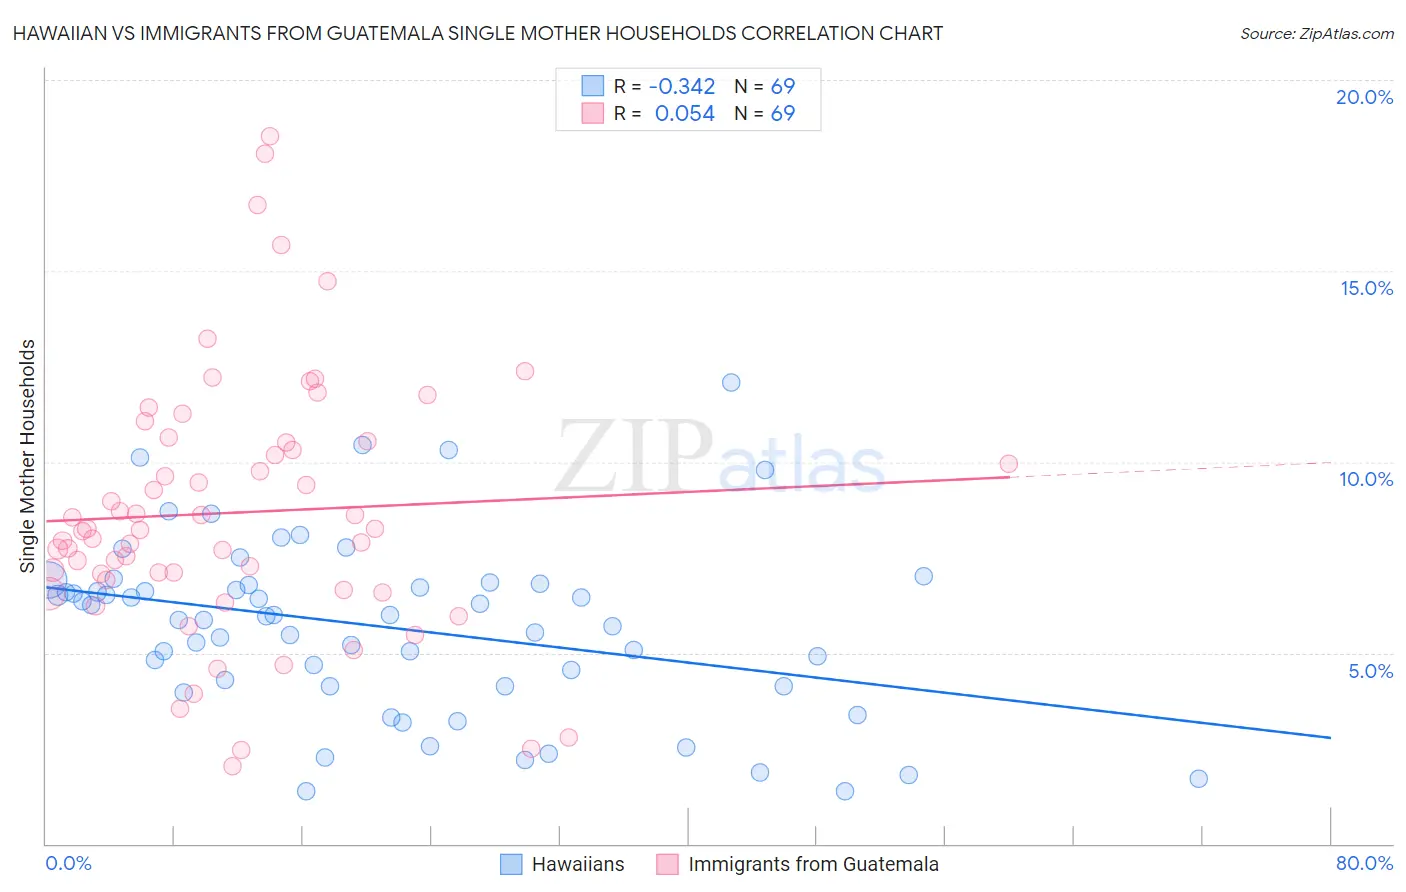
Hawaiian vs Immigrants from Guatemala Single Mother Households Correlation Chart
The statistical analysis conducted on geographies consisting of 326,738,155 people shows a mild negative correlation between the proportion of Hawaiians and percentage of single mother households in the United States with a correlation coefficient (R) of -0.342 and weighted average of 6.6%. Similarly, the statistical analysis conducted on geographies consisting of 376,787,729 people shows a slight positive correlation between the proportion of Immigrants from Guatemala and percentage of single mother households in the United States with a correlation coefficient (R) of 0.054 and weighted average of 7.7%, a difference of 17.2%.
Single Mother Households Correlation Summary
| Measurement | Hawaiian | Immigrants from Guatemala |
| Minimum | 1.4% | 2.0% |
| Maximum | 12.1% | 18.5% |
| Range | 10.7% | 16.5% |
| Mean | 5.7% | 8.7% |
| Median | 5.9% | 8.2% |
| Interquartile 25% (IQ1) | 4.1% | 6.8% |
| Interquartile 75% (IQ3) | 6.8% | 10.5% |
| Interquartile Range (IQR) | 2.7% | 3.7% |
| Standard Deviation (Sample) | 2.3% | 3.4% |
| Standard Deviation (Population) | 2.3% | 3.4% |
Similar Demographics by Single Mother Households
Demographics Similar to Hawaiians by Single Mother Households
In terms of single mother households, the demographic groups most similar to Hawaiians are Potawatomi (6.6%, a difference of 0.11%), Moroccan (6.6%, a difference of 0.25%), Immigrants from Ethiopia (6.6%, a difference of 0.27%), South American (6.6%, a difference of 0.36%), and Uruguayan (6.6%, a difference of 0.36%).
| Demographics | Rating | Rank | Single Mother Households |
| Samoans | 21.2 /100 | #191 | Fair 6.5% |
| Americans | 19.0 /100 | #192 | Poor 6.6% |
| Colombians | 18.3 /100 | #193 | Poor 6.6% |
| Immigrants | Uganda | 18.3 /100 | #194 | Poor 6.6% |
| South Americans | 18.0 /100 | #195 | Poor 6.6% |
| Uruguayans | 18.0 /100 | #196 | Poor 6.6% |
| Moroccans | 17.4 /100 | #197 | Poor 6.6% |
| Hawaiians | 16.1 /100 | #198 | Poor 6.6% |
| Potawatomi | 15.5 /100 | #199 | Poor 6.6% |
| Immigrants | Ethiopia | 14.7 /100 | #200 | Poor 6.6% |
| Venezuelans | 12.9 /100 | #201 | Poor 6.6% |
| Guamanians/Chamorros | 12.4 /100 | #202 | Poor 6.6% |
| Immigrants | Peru | 12.0 /100 | #203 | Poor 6.7% |
| Immigrants | Fiji | 11.9 /100 | #204 | Poor 6.7% |
| Cree | 11.9 /100 | #205 | Poor 6.7% |
Demographics Similar to Immigrants from Guatemala by Single Mother Households
In terms of single mother households, the demographic groups most similar to Immigrants from Guatemala are Sierra Leonean (7.7%, a difference of 0.050%), Immigrants from Middle Africa (7.7%, a difference of 0.10%), Trinidadian and Tobagonian (7.7%, a difference of 0.21%), Immigrants from Belize (7.7%, a difference of 0.24%), and Nigerian (7.7%, a difference of 0.84%).
| Demographics | Rating | Rank | Single Mother Households |
| Immigrants | Sierra Leone | 0.0 /100 | #280 | Tragic 7.7% |
| Immigrants | Laos | 0.0 /100 | #281 | Tragic 7.7% |
| Guatemalans | 0.0 /100 | #282 | Tragic 7.7% |
| Nigerians | 0.0 /100 | #283 | Tragic 7.7% |
| Immigrants | Belize | 0.0 /100 | #284 | Tragic 7.7% |
| Trinidadians and Tobagonians | 0.0 /100 | #285 | Tragic 7.7% |
| Immigrants | Middle Africa | 0.0 /100 | #286 | Tragic 7.7% |
| Immigrants | Guatemala | 0.0 /100 | #287 | Tragic 7.7% |
| Sierra Leoneans | 0.0 /100 | #288 | Tragic 7.7% |
| Sub-Saharan Africans | 0.0 /100 | #289 | Tragic 7.8% |
| Immigrants | Nigeria | 0.0 /100 | #290 | Tragic 7.8% |
| West Indians | 0.0 /100 | #291 | Tragic 7.8% |
| Ghanaians | 0.0 /100 | #292 | Tragic 7.8% |
| Immigrants | Cameroon | 0.0 /100 | #293 | Tragic 7.9% |
| Apache | 0.0 /100 | #294 | Tragic 7.9% |