Paraguayan vs Immigrants from Guatemala Single Mother Households
COMPARE
Paraguayan
Immigrants from Guatemala
Single Mother Households
Single Mother Households Comparison
Paraguayans
Immigrants from Guatemala
5.8%
SINGLE MOTHER HOUSEHOLDS
95.8/ 100
METRIC RATING
107th/ 347
METRIC RANK
7.7%
SINGLE MOTHER HOUSEHOLDS
0.0/ 100
METRIC RATING
287th/ 347
METRIC RANK
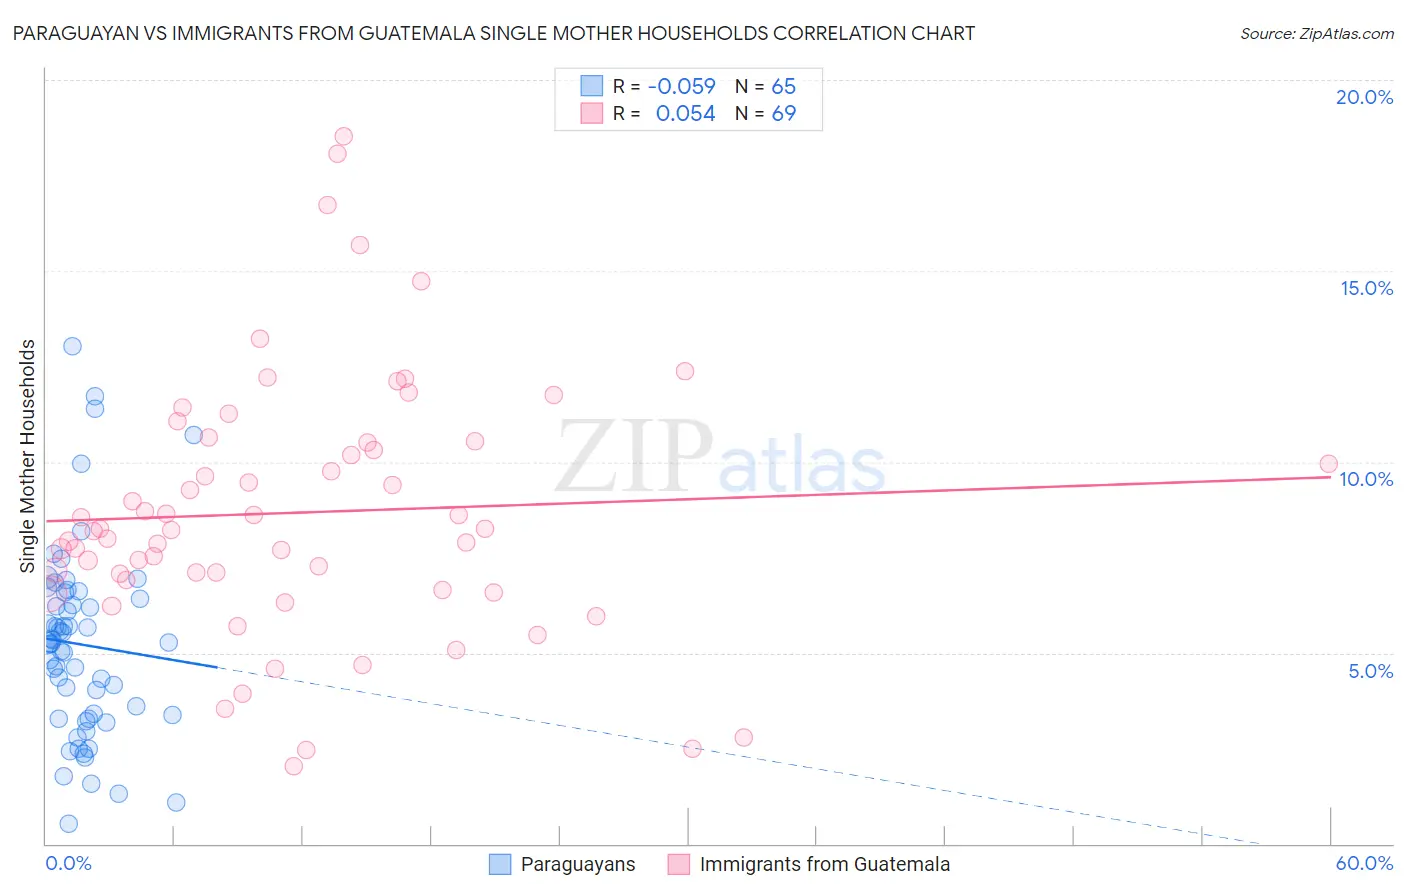
Paraguayan vs Immigrants from Guatemala Single Mother Households Correlation Chart
The statistical analysis conducted on geographies consisting of 95,050,877 people shows a slight negative correlation between the proportion of Paraguayans and percentage of single mother households in the United States with a correlation coefficient (R) of -0.059 and weighted average of 5.8%. Similarly, the statistical analysis conducted on geographies consisting of 376,787,729 people shows a slight positive correlation between the proportion of Immigrants from Guatemala and percentage of single mother households in the United States with a correlation coefficient (R) of 0.054 and weighted average of 7.7%, a difference of 34.0%.
Single Mother Households Correlation Summary
| Measurement | Paraguayan | Immigrants from Guatemala |
| Minimum | 0.54% | 2.0% |
| Maximum | 13.0% | 18.5% |
| Range | 12.5% | 16.5% |
| Mean | 5.2% | 8.7% |
| Median | 5.2% | 8.2% |
| Interquartile 25% (IQ1) | 3.3% | 6.8% |
| Interquartile 75% (IQ3) | 6.5% | 10.5% |
| Interquartile Range (IQR) | 3.2% | 3.7% |
| Standard Deviation (Sample) | 2.5% | 3.4% |
| Standard Deviation (Population) | 2.5% | 3.4% |
Similar Demographics by Single Mother Households
Demographics Similar to Paraguayans by Single Mother Households
In terms of single mother households, the demographic groups most similar to Paraguayans are Immigrants from Italy (5.8%, a difference of 0.010%), Immigrants from Western Europe (5.8%, a difference of 0.090%), Immigrants from Ukraine (5.8%, a difference of 0.11%), British (5.8%, a difference of 0.19%), and Taiwanese (5.8%, a difference of 0.22%).
| Demographics | Rating | Rank | Single Mother Households |
| Scandinavians | 96.2 /100 | #100 | Exceptional 5.8% |
| Germans | 96.2 /100 | #101 | Exceptional 5.8% |
| English | 96.2 /100 | #102 | Exceptional 5.8% |
| Scottish | 96.2 /100 | #103 | Exceptional 5.8% |
| Northern Europeans | 96.2 /100 | #104 | Exceptional 5.8% |
| Taiwanese | 96.1 /100 | #105 | Exceptional 5.8% |
| Immigrants | Ukraine | 95.9 /100 | #106 | Exceptional 5.8% |
| Paraguayans | 95.8 /100 | #107 | Exceptional 5.8% |
| Immigrants | Italy | 95.8 /100 | #108 | Exceptional 5.8% |
| Immigrants | Western Europe | 95.7 /100 | #109 | Exceptional 5.8% |
| British | 95.5 /100 | #110 | Exceptional 5.8% |
| Immigrants | England | 95.5 /100 | #111 | Exceptional 5.8% |
| Immigrants | Kuwait | 95.4 /100 | #112 | Exceptional 5.8% |
| Mongolians | 95.3 /100 | #113 | Exceptional 5.8% |
| Dutch | 95.1 /100 | #114 | Exceptional 5.8% |
Demographics Similar to Immigrants from Guatemala by Single Mother Households
In terms of single mother households, the demographic groups most similar to Immigrants from Guatemala are Sierra Leonean (7.7%, a difference of 0.050%), Immigrants from Middle Africa (7.7%, a difference of 0.10%), Trinidadian and Tobagonian (7.7%, a difference of 0.21%), Immigrants from Belize (7.7%, a difference of 0.24%), and Nigerian (7.7%, a difference of 0.84%).
| Demographics | Rating | Rank | Single Mother Households |
| Immigrants | Sierra Leone | 0.0 /100 | #280 | Tragic 7.7% |
| Immigrants | Laos | 0.0 /100 | #281 | Tragic 7.7% |
| Guatemalans | 0.0 /100 | #282 | Tragic 7.7% |
| Nigerians | 0.0 /100 | #283 | Tragic 7.7% |
| Immigrants | Belize | 0.0 /100 | #284 | Tragic 7.7% |
| Trinidadians and Tobagonians | 0.0 /100 | #285 | Tragic 7.7% |
| Immigrants | Middle Africa | 0.0 /100 | #286 | Tragic 7.7% |
| Immigrants | Guatemala | 0.0 /100 | #287 | Tragic 7.7% |
| Sierra Leoneans | 0.0 /100 | #288 | Tragic 7.7% |
| Sub-Saharan Africans | 0.0 /100 | #289 | Tragic 7.8% |
| Immigrants | Nigeria | 0.0 /100 | #290 | Tragic 7.8% |
| West Indians | 0.0 /100 | #291 | Tragic 7.8% |
| Ghanaians | 0.0 /100 | #292 | Tragic 7.8% |
| Immigrants | Cameroon | 0.0 /100 | #293 | Tragic 7.9% |
| Apache | 0.0 /100 | #294 | Tragic 7.9% |