Immigrants from Costa Rica vs Immigrants from Ethiopia Single Mother Households
COMPARE
Immigrants from Costa Rica
Immigrants from Ethiopia
Single Mother Households
Single Mother Households Comparison
Immigrants from Costa Rica
Immigrants from Ethiopia
6.7%
SINGLE MOTHER HOUSEHOLDS
8.2/ 100
METRIC RATING
213th/ 347
METRIC RANK
6.6%
SINGLE MOTHER HOUSEHOLDS
14.7/ 100
METRIC RATING
200th/ 347
METRIC RANK
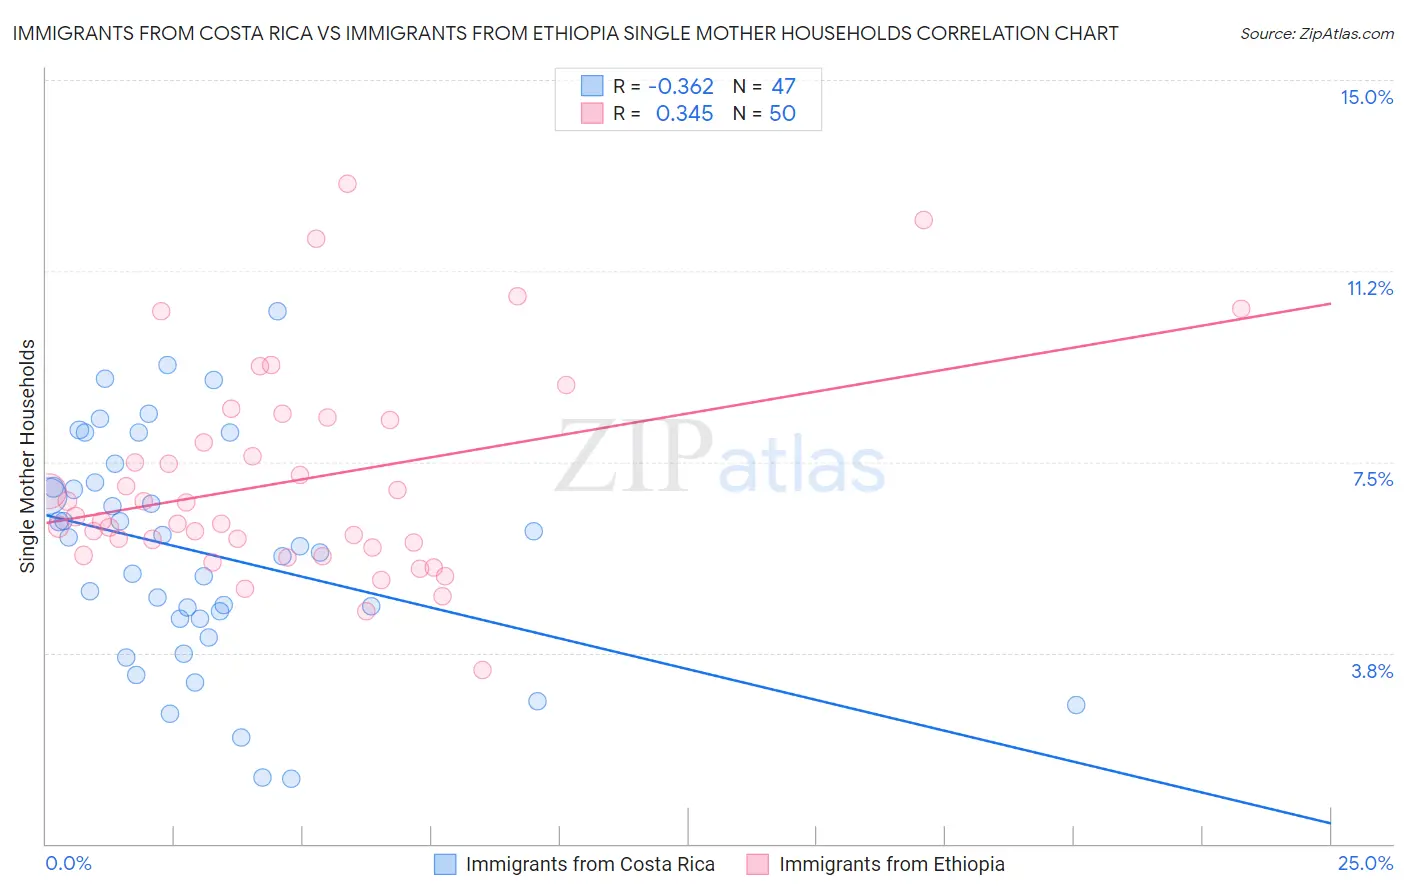
Immigrants from Costa Rica vs Immigrants from Ethiopia Single Mother Households Correlation Chart
The statistical analysis conducted on geographies consisting of 204,014,428 people shows a mild negative correlation between the proportion of Immigrants from Costa Rica and percentage of single mother households in the United States with a correlation coefficient (R) of -0.362 and weighted average of 6.7%. Similarly, the statistical analysis conducted on geographies consisting of 211,335,389 people shows a mild positive correlation between the proportion of Immigrants from Ethiopia and percentage of single mother households in the United States with a correlation coefficient (R) of 0.345 and weighted average of 6.6%, a difference of 1.7%.
Single Mother Households Correlation Summary
| Measurement | Immigrants from Costa Rica | Immigrants from Ethiopia |
| Minimum | 1.3% | 3.4% |
| Maximum | 10.5% | 13.0% |
| Range | 9.2% | 9.6% |
| Mean | 5.7% | 7.1% |
| Median | 5.8% | 6.4% |
| Interquartile 25% (IQ1) | 4.4% | 5.8% |
| Interquartile 75% (IQ3) | 7.1% | 8.3% |
| Interquartile Range (IQR) | 2.7% | 2.5% |
| Standard Deviation (Sample) | 2.2% | 2.1% |
| Standard Deviation (Population) | 2.2% | 2.0% |
Demographics Similar to Immigrants from Costa Rica and Immigrants from Ethiopia by Single Mother Households
In terms of single mother households, the demographic groups most similar to Immigrants from Costa Rica are Immigrants from Eritrea (6.7%, a difference of 0.050%), Immigrants from Venezuela (6.7%, a difference of 0.11%), Immigrants from Uruguay (6.7%, a difference of 0.11%), Nonimmigrants (6.7%, a difference of 0.69%), and Immigrants from Colombia (6.7%, a difference of 0.71%). Similarly, the demographic groups most similar to Immigrants from Ethiopia are Potawatomi (6.6%, a difference of 0.16%), Hawaiian (6.6%, a difference of 0.27%), Venezuelan (6.6%, a difference of 0.40%), Guamanian/Chamorro (6.6%, a difference of 0.52%), and Moroccan (6.6%, a difference of 0.53%).
| Demographics | Rating | Rank | Single Mother Households |
| Uruguayans | 18.0 /100 | #196 | Poor 6.6% |
| Moroccans | 17.4 /100 | #197 | Poor 6.6% |
| Hawaiians | 16.1 /100 | #198 | Poor 6.6% |
| Potawatomi | 15.5 /100 | #199 | Poor 6.6% |
| Immigrants | Ethiopia | 14.7 /100 | #200 | Poor 6.6% |
| Venezuelans | 12.9 /100 | #201 | Poor 6.6% |
| Guamanians/Chamorros | 12.4 /100 | #202 | Poor 6.6% |
| Immigrants | Peru | 12.0 /100 | #203 | Poor 6.7% |
| Immigrants | Fiji | 11.9 /100 | #204 | Poor 6.7% |
| Cree | 11.9 /100 | #205 | Poor 6.7% |
| German Russians | 11.5 /100 | #206 | Poor 6.7% |
| Immigrants | South America | 11.5 /100 | #207 | Poor 6.7% |
| Vietnamese | 11.3 /100 | #208 | Poor 6.7% |
| Immigrants | Colombia | 10.5 /100 | #209 | Poor 6.7% |
| Immigrants | Nonimmigrants | 10.4 /100 | #210 | Poor 6.7% |
| Immigrants | Venezuela | 8.5 /100 | #211 | Tragic 6.7% |
| Immigrants | Eritrea | 8.4 /100 | #212 | Tragic 6.7% |
| Immigrants | Costa Rica | 8.2 /100 | #213 | Tragic 6.7% |
| Immigrants | Uruguay | 7.9 /100 | #214 | Tragic 6.7% |
| Shoshone | 5.7 /100 | #215 | Tragic 6.8% |
| Cherokee | 5.1 /100 | #216 | Tragic 6.8% |