Native/Alaskan vs Immigrants from Ethiopia Single Mother Households
COMPARE
Native/Alaskan
Immigrants from Ethiopia
Single Mother Households
Single Mother Households Comparison
Natives/Alaskans
Immigrants from Ethiopia
8.0%
SINGLE MOTHER HOUSEHOLDS
0.0/ 100
METRIC RATING
304th/ 347
METRIC RANK
6.6%
SINGLE MOTHER HOUSEHOLDS
14.7/ 100
METRIC RATING
200th/ 347
METRIC RANK
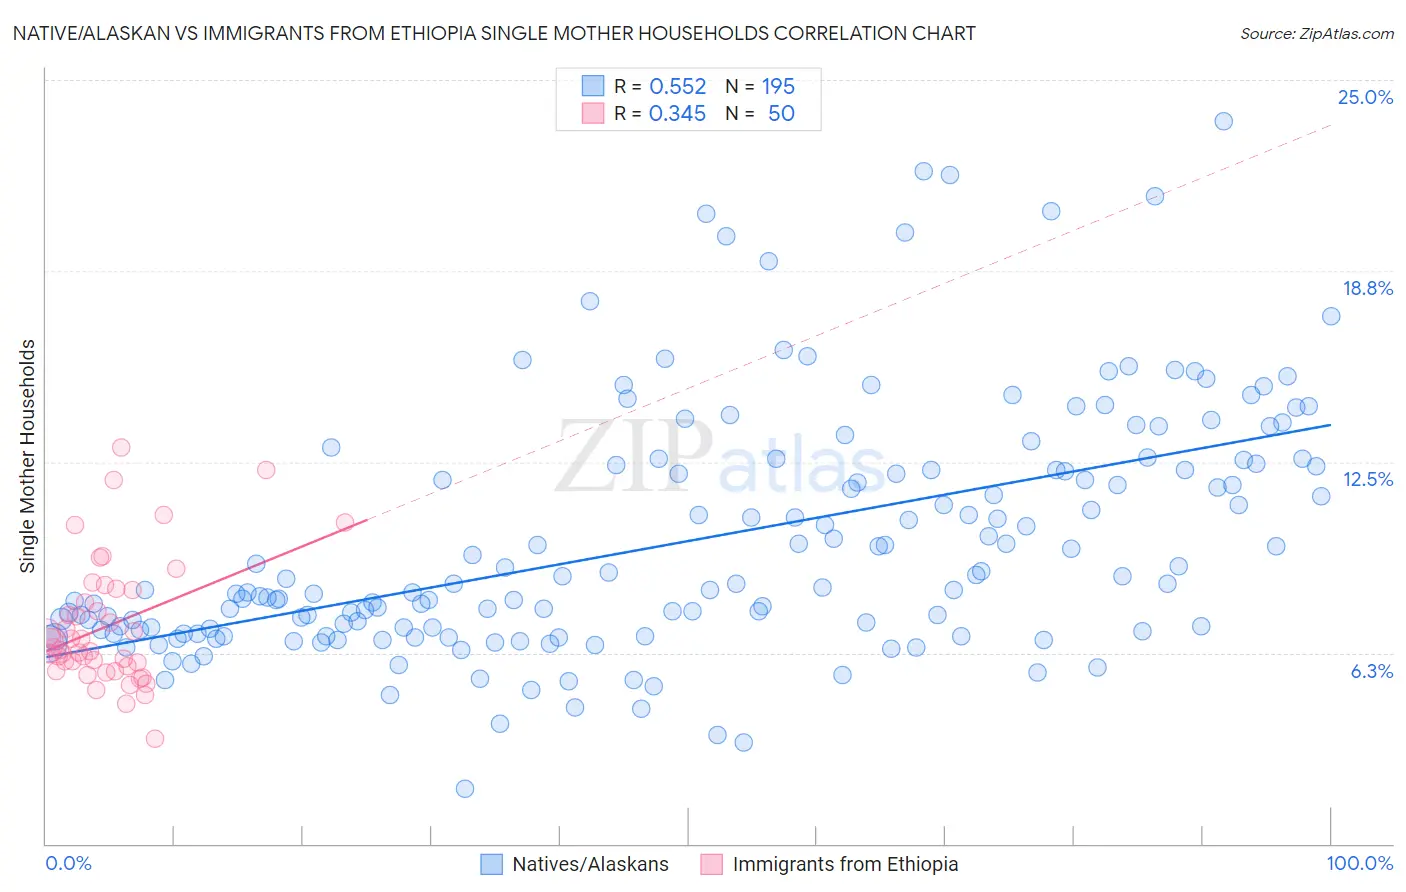
Native/Alaskan vs Immigrants from Ethiopia Single Mother Households Correlation Chart
The statistical analysis conducted on geographies consisting of 510,596,383 people shows a substantial positive correlation between the proportion of Natives/Alaskans and percentage of single mother households in the United States with a correlation coefficient (R) of 0.552 and weighted average of 8.0%. Similarly, the statistical analysis conducted on geographies consisting of 211,335,389 people shows a mild positive correlation between the proportion of Immigrants from Ethiopia and percentage of single mother households in the United States with a correlation coefficient (R) of 0.345 and weighted average of 6.6%, a difference of 21.3%.
Single Mother Households Correlation Summary
| Measurement | Native/Alaskan | Immigrants from Ethiopia |
| Minimum | 1.8% | 3.4% |
| Maximum | 23.6% | 13.0% |
| Range | 21.8% | 9.6% |
| Mean | 9.9% | 7.1% |
| Median | 8.4% | 6.4% |
| Interquartile 25% (IQ1) | 7.0% | 5.8% |
| Interquartile 75% (IQ3) | 12.4% | 8.3% |
| Interquartile Range (IQR) | 5.4% | 2.5% |
| Standard Deviation (Sample) | 4.0% | 2.1% |
| Standard Deviation (Population) | 4.0% | 2.0% |
Similar Demographics by Single Mother Households
Demographics Similar to Natives/Alaskans by Single Mother Households
In terms of single mother households, the demographic groups most similar to Natives/Alaskans are Colville (8.0%, a difference of 0.050%), Immigrants from Barbados (8.0%, a difference of 0.12%), Immigrants from St. Vincent and the Grenadines (8.0%, a difference of 0.36%), Immigrants from Central America (8.1%, a difference of 0.38%), and Immigrants from Bahamas (8.0%, a difference of 0.44%).
| Demographics | Rating | Rank | Single Mother Households |
| Hispanics or Latinos | 0.0 /100 | #297 | Tragic 7.9% |
| Immigrants | West Indies | 0.0 /100 | #298 | Tragic 7.9% |
| Houma | 0.0 /100 | #299 | Tragic 7.9% |
| Mexicans | 0.0 /100 | #300 | Tragic 8.0% |
| Chippewa | 0.0 /100 | #301 | Tragic 8.0% |
| Immigrants | Ghana | 0.0 /100 | #302 | Tragic 8.0% |
| Immigrants | Bahamas | 0.0 /100 | #303 | Tragic 8.0% |
| Natives/Alaskans | 0.0 /100 | #304 | Tragic 8.0% |
| Colville | 0.0 /100 | #305 | Tragic 8.0% |
| Immigrants | Barbados | 0.0 /100 | #306 | Tragic 8.0% |
| Immigrants | St. Vincent and the Grenadines | 0.0 /100 | #307 | Tragic 8.0% |
| Immigrants | Central America | 0.0 /100 | #308 | Tragic 8.1% |
| Cheyenne | 0.0 /100 | #309 | Tragic 8.1% |
| Hondurans | 0.0 /100 | #310 | Tragic 8.1% |
| Immigrants | Congo | 0.0 /100 | #311 | Tragic 8.1% |
Demographics Similar to Immigrants from Ethiopia by Single Mother Households
In terms of single mother households, the demographic groups most similar to Immigrants from Ethiopia are Potawatomi (6.6%, a difference of 0.16%), Hawaiian (6.6%, a difference of 0.27%), Venezuelan (6.6%, a difference of 0.40%), Guamanian/Chamorro (6.6%, a difference of 0.52%), and Moroccan (6.6%, a difference of 0.53%).
| Demographics | Rating | Rank | Single Mother Households |
| Colombians | 18.3 /100 | #193 | Poor 6.6% |
| Immigrants | Uganda | 18.3 /100 | #194 | Poor 6.6% |
| South Americans | 18.0 /100 | #195 | Poor 6.6% |
| Uruguayans | 18.0 /100 | #196 | Poor 6.6% |
| Moroccans | 17.4 /100 | #197 | Poor 6.6% |
| Hawaiians | 16.1 /100 | #198 | Poor 6.6% |
| Potawatomi | 15.5 /100 | #199 | Poor 6.6% |
| Immigrants | Ethiopia | 14.7 /100 | #200 | Poor 6.6% |
| Venezuelans | 12.9 /100 | #201 | Poor 6.6% |
| Guamanians/Chamorros | 12.4 /100 | #202 | Poor 6.6% |
| Immigrants | Peru | 12.0 /100 | #203 | Poor 6.7% |
| Immigrants | Fiji | 11.9 /100 | #204 | Poor 6.7% |
| Cree | 11.9 /100 | #205 | Poor 6.7% |
| German Russians | 11.5 /100 | #206 | Poor 6.7% |
| Immigrants | South America | 11.5 /100 | #207 | Poor 6.7% |