Immigrants from South Eastern Asia vs Native Hawaiian Family Households
COMPARE
Immigrants from South Eastern Asia
Native Hawaiian
Family Households
Family Households Comparison
Immigrants from South Eastern Asia
Native Hawaiians
67.5%
FAMILY HOUSEHOLDS
100.0/ 100
METRIC RATING
24th/ 347
METRIC RANK
68.4%
FAMILY HOUSEHOLDS
100.0/ 100
METRIC RATING
9th/ 347
METRIC RANK
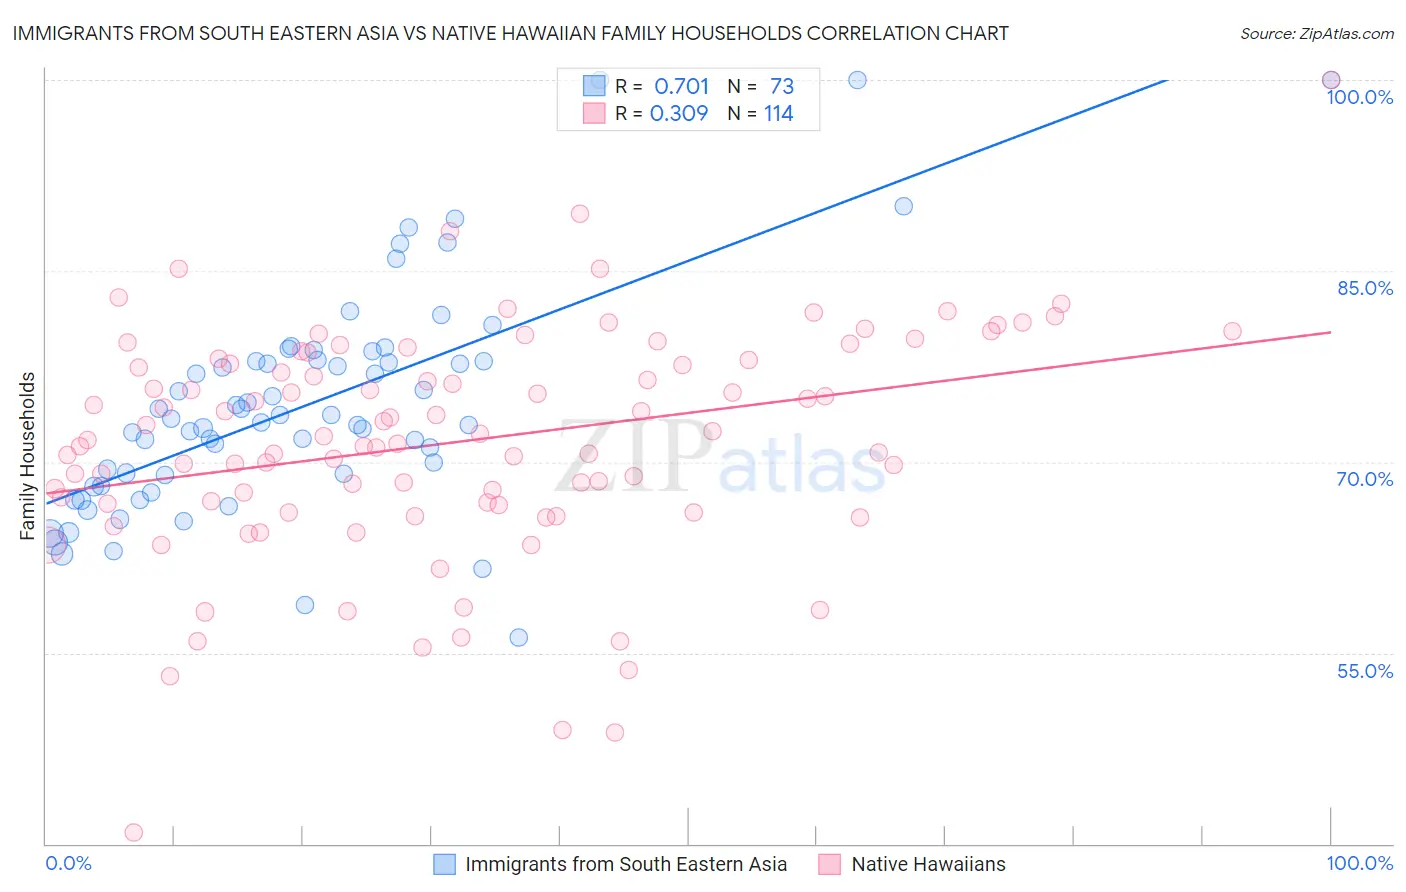
Immigrants from South Eastern Asia vs Native Hawaiian Family Households Correlation Chart
The statistical analysis conducted on geographies consisting of 512,232,151 people shows a strong positive correlation between the proportion of Immigrants from South Eastern Asia and percentage of family households in the United States with a correlation coefficient (R) of 0.701 and weighted average of 67.5%. Similarly, the statistical analysis conducted on geographies consisting of 331,876,640 people shows a mild positive correlation between the proportion of Native Hawaiians and percentage of family households in the United States with a correlation coefficient (R) of 0.309 and weighted average of 68.4%, a difference of 1.3%.
Family Households Correlation Summary
| Measurement | Immigrants from South Eastern Asia | Native Hawaiian |
| Minimum | 56.2% | 40.9% |
| Maximum | 100.0% | 100.0% |
| Range | 43.8% | 59.1% |
| Mean | 74.5% | 71.6% |
| Median | 73.4% | 71.9% |
| Interquartile 25% (IQ1) | 68.5% | 66.7% |
| Interquartile 75% (IQ3) | 78.0% | 78.0% |
| Interquartile Range (IQR) | 9.4% | 11.3% |
| Standard Deviation (Sample) | 8.8% | 9.1% |
| Standard Deviation (Population) | 8.7% | 9.0% |
Demographics Similar to Immigrants from South Eastern Asia and Native Hawaiians by Family Households
In terms of family households, the demographic groups most similar to Immigrants from South Eastern Asia are Immigrants from Nicaragua (67.5%, a difference of 0.020%), Immigrants from India (67.4%, a difference of 0.040%), Immigrants from Pakistan (67.7%, a difference of 0.28%), Sri Lankan (67.7%, a difference of 0.37%), and Cuban (67.7%, a difference of 0.41%). Similarly, the demographic groups most similar to Native Hawaiians are Immigrants from Philippines (68.3%, a difference of 0.070%), Immigrants from Central America (68.3%, a difference of 0.14%), Korean (68.3%, a difference of 0.17%), Pueblo (68.2%, a difference of 0.25%), and Immigrants from Cuba (68.2%, a difference of 0.26%).
| Demographics | Rating | Rank | Family Households |
| Immigrants | Mexico | 100.0 /100 | #6 | Exceptional 69.1% |
| Mexicans | 100.0 /100 | #7 | Exceptional 69.0% |
| Immigrants | Fiji | 100.0 /100 | #8 | Exceptional 68.8% |
| Native Hawaiians | 100.0 /100 | #9 | Exceptional 68.4% |
| Immigrants | Philippines | 100.0 /100 | #10 | Exceptional 68.3% |
| Immigrants | Central America | 100.0 /100 | #11 | Exceptional 68.3% |
| Koreans | 100.0 /100 | #12 | Exceptional 68.3% |
| Pueblo | 100.0 /100 | #13 | Exceptional 68.2% |
| Immigrants | Cuba | 100.0 /100 | #14 | Exceptional 68.2% |
| Assyrians/Chaldeans/Syriacs | 100.0 /100 | #15 | Exceptional 68.2% |
| Immigrants | Vietnam | 100.0 /100 | #16 | Exceptional 68.2% |
| Chinese | 100.0 /100 | #17 | Exceptional 68.1% |
| Immigrants | Taiwan | 100.0 /100 | #18 | Exceptional 68.0% |
| Samoans | 100.0 /100 | #19 | Exceptional 67.9% |
| Inupiat | 100.0 /100 | #20 | Exceptional 67.8% |
| Cubans | 100.0 /100 | #21 | Exceptional 67.7% |
| Sri Lankans | 100.0 /100 | #22 | Exceptional 67.7% |
| Immigrants | Pakistan | 100.0 /100 | #23 | Exceptional 67.7% |
| Immigrants | South Eastern Asia | 100.0 /100 | #24 | Exceptional 67.5% |
| Immigrants | Nicaragua | 100.0 /100 | #25 | Exceptional 67.5% |
| Immigrants | India | 100.0 /100 | #26 | Exceptional 67.4% |