Immigrants from Ecuador vs Native Hawaiian Family Households
COMPARE
Immigrants from Ecuador
Native Hawaiian
Family Households
Family Households Comparison
Immigrants from Ecuador
Native Hawaiians
64.8%
FAMILY HOUSEHOLDS
91.4/ 100
METRIC RATING
129th/ 347
METRIC RANK
68.4%
FAMILY HOUSEHOLDS
100.0/ 100
METRIC RATING
9th/ 347
METRIC RANK
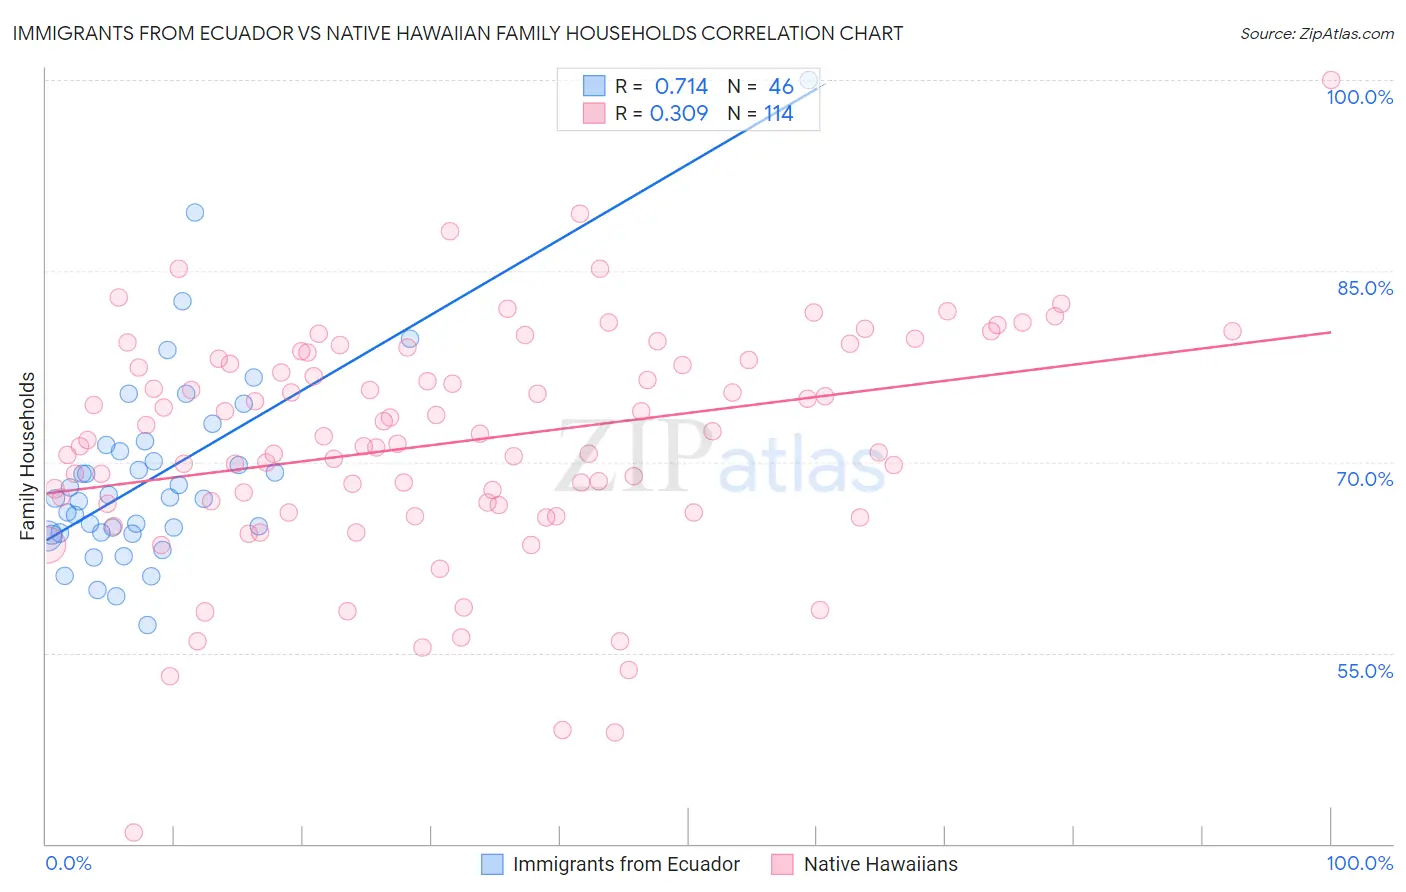
Immigrants from Ecuador vs Native Hawaiian Family Households Correlation Chart
The statistical analysis conducted on geographies consisting of 270,888,190 people shows a strong positive correlation between the proportion of Immigrants from Ecuador and percentage of family households in the United States with a correlation coefficient (R) of 0.714 and weighted average of 64.8%. Similarly, the statistical analysis conducted on geographies consisting of 331,876,640 people shows a mild positive correlation between the proportion of Native Hawaiians and percentage of family households in the United States with a correlation coefficient (R) of 0.309 and weighted average of 68.4%, a difference of 5.5%.
Family Households Correlation Summary
| Measurement | Immigrants from Ecuador | Native Hawaiian |
| Minimum | 57.2% | 40.9% |
| Maximum | 100.0% | 100.0% |
| Range | 42.8% | 59.1% |
| Mean | 69.0% | 71.6% |
| Median | 67.2% | 71.9% |
| Interquartile 25% (IQ1) | 64.4% | 66.7% |
| Interquartile 75% (IQ3) | 71.4% | 78.0% |
| Interquartile Range (IQR) | 7.0% | 11.3% |
| Standard Deviation (Sample) | 7.8% | 9.1% |
| Standard Deviation (Population) | 7.8% | 9.0% |
Similar Demographics by Family Households
Demographics Similar to Immigrants from Ecuador by Family Households
In terms of family households, the demographic groups most similar to Immigrants from Ecuador are Italian (64.8%, a difference of 0.020%), Immigrants from Panama (64.8%, a difference of 0.030%), Panamanian (64.8%, a difference of 0.050%), Immigrants from Italy (64.8%, a difference of 0.050%), and Nonimmigrants (64.8%, a difference of 0.050%).
| Demographics | Rating | Rank | Family Households |
| Hmong | 93.4 /100 | #122 | Exceptional 64.9% |
| Choctaw | 93.4 /100 | #123 | Exceptional 64.9% |
| Immigrants | Argentina | 92.8 /100 | #124 | Exceptional 64.9% |
| Immigrants | Belize | 92.7 /100 | #125 | Exceptional 64.9% |
| Panamanians | 92.4 /100 | #126 | Exceptional 64.8% |
| Immigrants | Panama | 92.0 /100 | #127 | Exceptional 64.8% |
| Italians | 91.9 /100 | #128 | Exceptional 64.8% |
| Immigrants | Ecuador | 91.4 /100 | #129 | Exceptional 64.8% |
| Immigrants | Italy | 90.2 /100 | #130 | Exceptional 64.8% |
| Immigrants | Nonimmigrants | 90.1 /100 | #131 | Exceptional 64.8% |
| Cajuns | 89.4 /100 | #132 | Excellent 64.8% |
| Belizeans | 89.3 /100 | #133 | Excellent 64.8% |
| Greeks | 88.1 /100 | #134 | Excellent 64.7% |
| Maltese | 87.4 /100 | #135 | Excellent 64.7% |
| Immigrants | China | 86.6 /100 | #136 | Excellent 64.7% |
Demographics Similar to Native Hawaiians by Family Households
In terms of family households, the demographic groups most similar to Native Hawaiians are Immigrants from Philippines (68.3%, a difference of 0.070%), Immigrants from Central America (68.3%, a difference of 0.14%), Korean (68.3%, a difference of 0.17%), Pueblo (68.2%, a difference of 0.25%), and Immigrants from Cuba (68.2%, a difference of 0.26%).
| Demographics | Rating | Rank | Family Households |
| Spanish American Indians | 100.0 /100 | #2 | Exceptional 71.2% |
| Tongans | 100.0 /100 | #3 | Exceptional 69.6% |
| Yakama | 100.0 /100 | #4 | Exceptional 69.3% |
| Yuman | 100.0 /100 | #5 | Exceptional 69.3% |
| Immigrants | Mexico | 100.0 /100 | #6 | Exceptional 69.1% |
| Mexicans | 100.0 /100 | #7 | Exceptional 69.0% |
| Immigrants | Fiji | 100.0 /100 | #8 | Exceptional 68.8% |
| Native Hawaiians | 100.0 /100 | #9 | Exceptional 68.4% |
| Immigrants | Philippines | 100.0 /100 | #10 | Exceptional 68.3% |
| Immigrants | Central America | 100.0 /100 | #11 | Exceptional 68.3% |
| Koreans | 100.0 /100 | #12 | Exceptional 68.3% |
| Pueblo | 100.0 /100 | #13 | Exceptional 68.2% |
| Immigrants | Cuba | 100.0 /100 | #14 | Exceptional 68.2% |
| Assyrians/Chaldeans/Syriacs | 100.0 /100 | #15 | Exceptional 68.2% |
| Immigrants | Vietnam | 100.0 /100 | #16 | Exceptional 68.2% |