Ecuadorian vs Immigrants from Venezuela Currently Married
COMPARE
Ecuadorian
Immigrants from Venezuela
Currently Married
Currently Married Comparison
Ecuadorians
Immigrants from Venezuela
43.6%
CURRENTLY MARRIED
0.1/ 100
METRIC RATING
266th/ 347
METRIC RANK
47.0%
CURRENTLY MARRIED
68.6/ 100
METRIC RATING
153rd/ 347
METRIC RANK
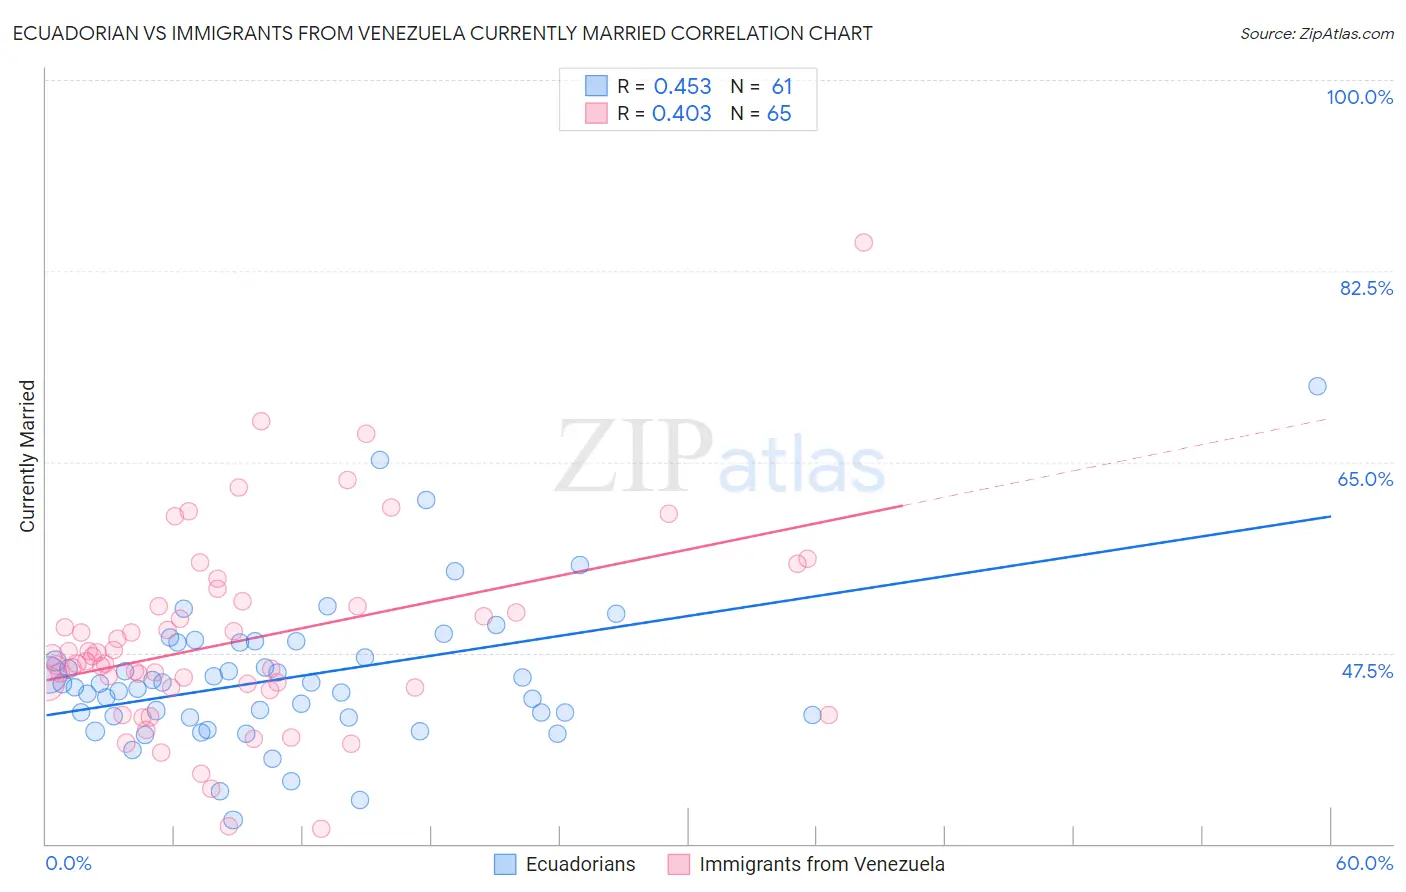
Ecuadorian vs Immigrants from Venezuela Currently Married Correlation Chart
The statistical analysis conducted on geographies consisting of 317,807,476 people shows a moderate positive correlation between the proportion of Ecuadorians and percentage of population currently married in the United States with a correlation coefficient (R) of 0.453 and weighted average of 43.6%. Similarly, the statistical analysis conducted on geographies consisting of 287,838,026 people shows a moderate positive correlation between the proportion of Immigrants from Venezuela and percentage of population currently married in the United States with a correlation coefficient (R) of 0.403 and weighted average of 47.0%, a difference of 7.7%.
Currently Married Correlation Summary
| Measurement | Ecuadorian | Immigrants from Venezuela |
| Minimum | 32.2% | 31.4% |
| Maximum | 71.9% | 85.1% |
| Range | 39.7% | 53.7% |
| Mean | 45.2% | 48.6% |
| Median | 44.6% | 46.7% |
| Interquartile 25% (IQ1) | 41.7% | 44.3% |
| Interquartile 75% (IQ3) | 48.4% | 51.7% |
| Interquartile Range (IQR) | 6.8% | 7.4% |
| Standard Deviation (Sample) | 6.7% | 9.0% |
| Standard Deviation (Population) | 6.7% | 8.9% |
Similar Demographics by Currently Married
Demographics Similar to Ecuadorians by Currently Married
In terms of currently married, the demographic groups most similar to Ecuadorians are Immigrants from Eritrea (43.6%, a difference of 0.030%), Spanish American Indian (43.6%, a difference of 0.030%), Immigrants from Bangladesh (43.6%, a difference of 0.070%), Sudanese (43.7%, a difference of 0.15%), and Immigrants from Cuba (43.7%, a difference of 0.16%).
| Demographics | Rating | Rank | Currently Married |
| Immigrants | Sierra Leone | 0.1 /100 | #259 | Tragic 43.8% |
| Immigrants | Latin America | 0.1 /100 | #260 | Tragic 43.8% |
| Immigrants | Nicaragua | 0.1 /100 | #261 | Tragic 43.7% |
| Bangladeshis | 0.1 /100 | #262 | Tragic 43.7% |
| Immigrants | Cuba | 0.1 /100 | #263 | Tragic 43.7% |
| Sudanese | 0.1 /100 | #264 | Tragic 43.7% |
| Immigrants | Bangladesh | 0.1 /100 | #265 | Tragic 43.6% |
| Ecuadorians | 0.1 /100 | #266 | Tragic 43.6% |
| Immigrants | Eritrea | 0.1 /100 | #267 | Tragic 43.6% |
| Spanish American Indians | 0.1 /100 | #268 | Tragic 43.6% |
| Immigrants | Sudan | 0.1 /100 | #269 | Tragic 43.5% |
| Salvadorans | 0.1 /100 | #270 | Tragic 43.5% |
| Bermudans | 0.1 /100 | #271 | Tragic 43.5% |
| Indonesians | 0.1 /100 | #272 | Tragic 43.5% |
| Yaqui | 0.1 /100 | #273 | Tragic 43.4% |
Demographics Similar to Immigrants from Venezuela by Currently Married
In terms of currently married, the demographic groups most similar to Immigrants from Venezuela are Albanian (47.0%, a difference of 0.0%), Arab (47.0%, a difference of 0.0%), Immigrants from Serbia (47.0%, a difference of 0.010%), Spanish (47.0%, a difference of 0.020%), and Immigrants from Switzerland (46.9%, a difference of 0.030%).
| Demographics | Rating | Rank | Currently Married |
| Carpatho Rusyns | 72.6 /100 | #146 | Good 47.0% |
| Immigrants | Argentina | 72.0 /100 | #147 | Good 47.0% |
| Cambodians | 70.4 /100 | #148 | Good 47.0% |
| Zimbabweans | 70.1 /100 | #149 | Good 47.0% |
| Immigrants | Turkey | 70.0 /100 | #150 | Good 47.0% |
| Chileans | 69.8 /100 | #151 | Good 47.0% |
| Immigrants | Serbia | 68.8 /100 | #152 | Good 47.0% |
| Immigrants | Venezuela | 68.6 /100 | #153 | Good 47.0% |
| Albanians | 68.6 /100 | #154 | Good 47.0% |
| Arabs | 68.6 /100 | #155 | Good 47.0% |
| Spanish | 68.1 /100 | #156 | Good 47.0% |
| Immigrants | Switzerland | 67.8 /100 | #157 | Good 46.9% |
| Cherokee | 66.8 /100 | #158 | Good 46.9% |
| Iraqis | 66.4 /100 | #159 | Good 46.9% |
| Immigrants | Uzbekistan | 66.0 /100 | #160 | Good 46.9% |