Pennsylvania German vs Immigrants from Burma/Myanmar Single Mother Households
COMPARE
Pennsylvania German
Immigrants from Burma/Myanmar
Single Mother Households
Single Mother Households Comparison
Pennsylvania Germans
Immigrants from Burma/Myanmar
5.8%
SINGLE MOTHER HOUSEHOLDS
94.7/ 100
METRIC RATING
116th/ 347
METRIC RANK
7.0%
SINGLE MOTHER HOUSEHOLDS
1.4/ 100
METRIC RATING
235th/ 347
METRIC RANK
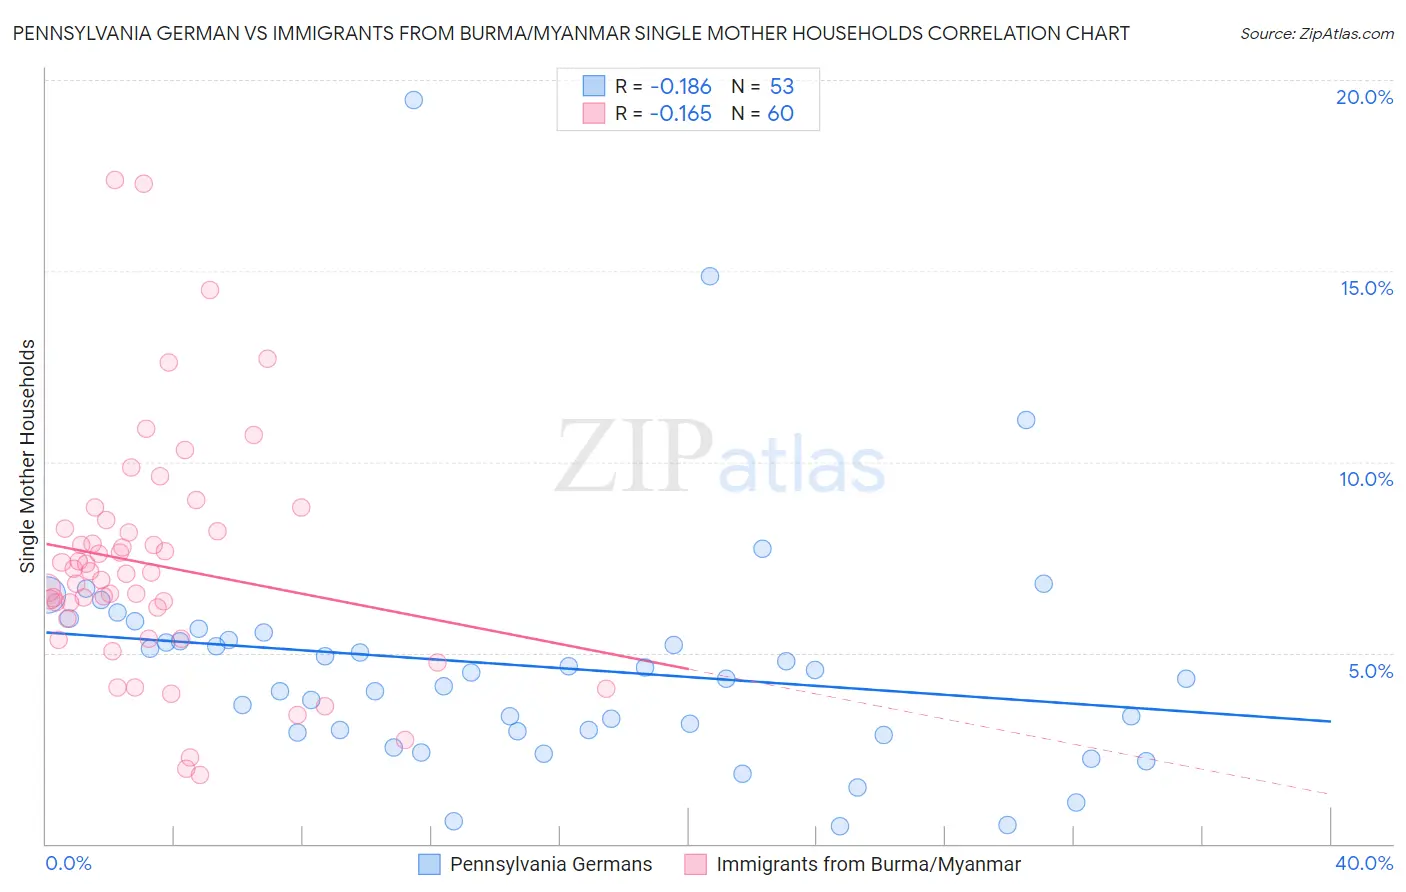
Pennsylvania German vs Immigrants from Burma/Myanmar Single Mother Households Correlation Chart
The statistical analysis conducted on geographies consisting of 233,304,325 people shows a poor negative correlation between the proportion of Pennsylvania Germans and percentage of single mother households in the United States with a correlation coefficient (R) of -0.186 and weighted average of 5.8%. Similarly, the statistical analysis conducted on geographies consisting of 172,110,214 people shows a poor negative correlation between the proportion of Immigrants from Burma/Myanmar and percentage of single mother households in the United States with a correlation coefficient (R) of -0.165 and weighted average of 7.0%, a difference of 21.3%.
Single Mother Households Correlation Summary
| Measurement | Pennsylvania German | Immigrants from Burma/Myanmar |
| Minimum | 0.44% | 1.8% |
| Maximum | 19.5% | 17.4% |
| Range | 19.0% | 15.6% |
| Mean | 4.6% | 7.3% |
| Median | 4.3% | 7.1% |
| Interquartile 25% (IQ1) | 2.9% | 5.6% |
| Interquartile 75% (IQ3) | 5.4% | 8.2% |
| Interquartile Range (IQR) | 2.5% | 2.6% |
| Standard Deviation (Sample) | 3.2% | 3.1% |
| Standard Deviation (Population) | 3.2% | 3.1% |
Similar Demographics by Single Mother Households
Demographics Similar to Pennsylvania Germans by Single Mother Households
In terms of single mother households, the demographic groups most similar to Pennsylvania Germans are Irish (5.8%, a difference of 0.070%), Bolivian (5.8%, a difference of 0.070%), Dutch (5.8%, a difference of 0.25%), Laotian (5.8%, a difference of 0.25%), and South African (5.8%, a difference of 0.36%).
| Demographics | Rating | Rank | Single Mother Households |
| Immigrants | Western Europe | 95.7 /100 | #109 | Exceptional 5.8% |
| British | 95.5 /100 | #110 | Exceptional 5.8% |
| Immigrants | England | 95.5 /100 | #111 | Exceptional 5.8% |
| Immigrants | Kuwait | 95.4 /100 | #112 | Exceptional 5.8% |
| Mongolians | 95.3 /100 | #113 | Exceptional 5.8% |
| Dutch | 95.1 /100 | #114 | Exceptional 5.8% |
| Irish | 94.8 /100 | #115 | Exceptional 5.8% |
| Pennsylvania Germans | 94.7 /100 | #116 | Exceptional 5.8% |
| Bolivians | 94.6 /100 | #117 | Exceptional 5.8% |
| Laotians | 94.3 /100 | #118 | Exceptional 5.8% |
| South Africans | 94.1 /100 | #119 | Exceptional 5.8% |
| Tongans | 93.7 /100 | #120 | Exceptional 5.8% |
| Argentineans | 93.7 /100 | #121 | Exceptional 5.8% |
| Belgians | 93.5 /100 | #122 | Exceptional 5.8% |
| Immigrants | Uzbekistan | 93.4 /100 | #123 | Exceptional 5.9% |
Demographics Similar to Immigrants from Burma/Myanmar by Single Mother Households
In terms of single mother households, the demographic groups most similar to Immigrants from Burma/Myanmar are Chickasaw (7.0%, a difference of 0.070%), Choctaw (7.0%, a difference of 0.090%), Comanche (7.0%, a difference of 0.26%), Spanish American (7.0%, a difference of 0.32%), and Creek (7.0%, a difference of 0.34%).
| Demographics | Rating | Rank | Single Mother Households |
| Iroquois | 2.2 /100 | #228 | Tragic 7.0% |
| Immigrants | Kenya | 2.1 /100 | #229 | Tragic 7.0% |
| Creek | 1.6 /100 | #230 | Tragic 7.0% |
| Spanish Americans | 1.6 /100 | #231 | Tragic 7.0% |
| Comanche | 1.5 /100 | #232 | Tragic 7.0% |
| Choctaw | 1.4 /100 | #233 | Tragic 7.0% |
| Chickasaw | 1.4 /100 | #234 | Tragic 7.0% |
| Immigrants | Burma/Myanmar | 1.4 /100 | #235 | Tragic 7.0% |
| Ute | 1.0 /100 | #236 | Tragic 7.1% |
| Arapaho | 1.0 /100 | #237 | Tragic 7.1% |
| Panamanians | 0.9 /100 | #238 | Tragic 7.1% |
| Kiowa | 0.8 /100 | #239 | Tragic 7.1% |
| Immigrants | Panama | 0.7 /100 | #240 | Tragic 7.2% |
| Immigrants | Portugal | 0.6 /100 | #241 | Tragic 7.2% |
| Fijians | 0.6 /100 | #242 | Tragic 7.2% |