Paraguayan vs Turkish 11th Grade
COMPARE
Paraguayan
Turkish
11th Grade
11th Grade Comparison
Paraguayans
Turks
92.7%
11TH GRADE
68.7/ 100
METRIC RATING
162nd/ 347
METRIC RANK
94.0%
11TH GRADE
99.9/ 100
METRIC RATING
51st/ 347
METRIC RANK
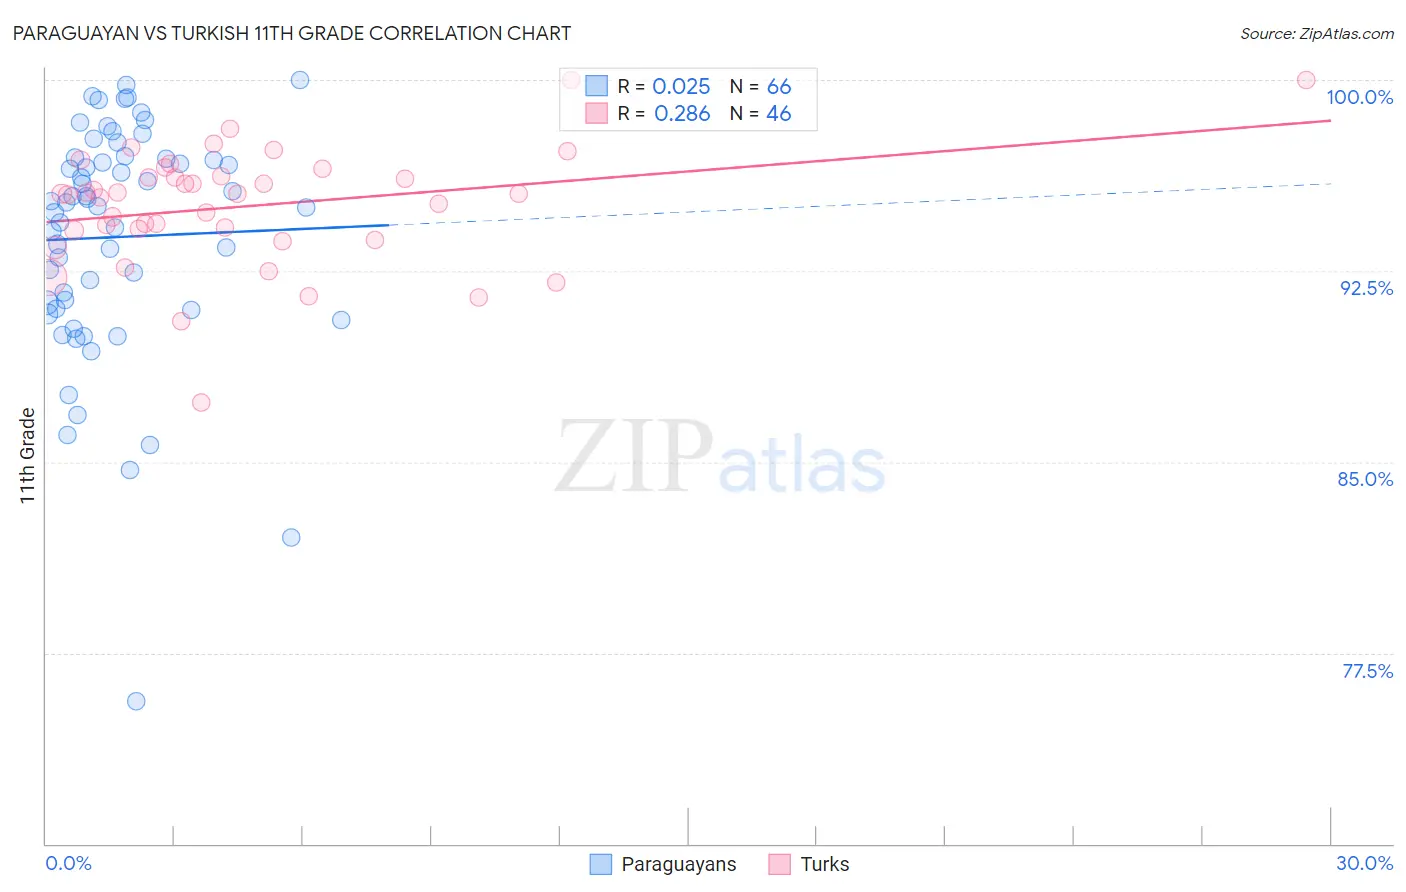
Paraguayan vs Turkish 11th Grade Correlation Chart
The statistical analysis conducted on geographies consisting of 95,114,201 people shows no correlation between the proportion of Paraguayans and percentage of population with at least 11th grade education in the United States with a correlation coefficient (R) of 0.025 and weighted average of 92.7%. Similarly, the statistical analysis conducted on geographies consisting of 271,864,104 people shows a weak positive correlation between the proportion of Turks and percentage of population with at least 11th grade education in the United States with a correlation coefficient (R) of 0.286 and weighted average of 94.0%, a difference of 1.4%.
11th Grade Correlation Summary
| Measurement | Paraguayan | Turkish |
| Minimum | 75.6% | 87.4% |
| Maximum | 100.0% | 100.0% |
| Range | 24.4% | 12.6% |
| Mean | 93.8% | 95.0% |
| Median | 95.1% | 95.5% |
| Interquartile 25% (IQ1) | 91.0% | 94.1% |
| Interquartile 75% (IQ3) | 96.9% | 96.2% |
| Interquartile Range (IQR) | 5.9% | 2.1% |
| Standard Deviation (Sample) | 4.6% | 2.3% |
| Standard Deviation (Population) | 4.6% | 2.3% |
Similar Demographics by 11th Grade
Demographics Similar to Paraguayans by 11th Grade
In terms of 11th grade, the demographic groups most similar to Paraguayans are Immigrants from Argentina (92.7%, a difference of 0.010%), Immigrants from Lebanon (92.7%, a difference of 0.020%), Nonimmigrants (92.7%, a difference of 0.020%), American (92.7%, a difference of 0.030%), and Spanish (92.7%, a difference of 0.030%).
| Demographics | Rating | Rank | 11th Grade |
| Argentineans | 73.4 /100 | #155 | Good 92.7% |
| Immigrants | Spain | 73.0 /100 | #156 | Good 92.7% |
| Immigrants | Eastern Asia | 72.6 /100 | #157 | Good 92.7% |
| Immigrants | Venezuela | 72.0 /100 | #158 | Good 92.7% |
| Americans | 71.7 /100 | #159 | Good 92.7% |
| Immigrants | Lebanon | 70.7 /100 | #160 | Good 92.7% |
| Immigrants | Argentina | 69.8 /100 | #161 | Good 92.7% |
| Paraguayans | 68.7 /100 | #162 | Good 92.7% |
| Immigrants | Nonimmigrants | 66.6 /100 | #163 | Good 92.7% |
| Spanish | 66.2 /100 | #164 | Good 92.7% |
| Immigrants | Iraq | 63.7 /100 | #165 | Good 92.6% |
| Bermudans | 62.3 /100 | #166 | Good 92.6% |
| Alsatians | 60.2 /100 | #167 | Good 92.6% |
| Sierra Leoneans | 58.7 /100 | #168 | Average 92.6% |
| Immigrants | Albania | 57.8 /100 | #169 | Average 92.6% |
Demographics Similar to Turks by 11th Grade
In terms of 11th grade, the demographic groups most similar to Turks are Immigrants from Canada (94.0%, a difference of 0.010%), Immigrants from Australia (94.0%, a difference of 0.020%), Filipino (94.1%, a difference of 0.030%), Macedonian (94.1%, a difference of 0.030%), and Slavic (94.1%, a difference of 0.030%).
| Demographics | Rating | Rank | 11th Grade |
| Immigrants | Ireland | 99.9 /100 | #44 | Exceptional 94.1% |
| Australians | 99.9 /100 | #45 | Exceptional 94.1% |
| Serbians | 99.9 /100 | #46 | Exceptional 94.1% |
| Filipinos | 99.9 /100 | #47 | Exceptional 94.1% |
| Macedonians | 99.9 /100 | #48 | Exceptional 94.1% |
| Slavs | 99.9 /100 | #49 | Exceptional 94.1% |
| French | 99.9 /100 | #50 | Exceptional 94.1% |
| Turks | 99.9 /100 | #51 | Exceptional 94.0% |
| Immigrants | Canada | 99.9 /100 | #52 | Exceptional 94.0% |
| Immigrants | Australia | 99.9 /100 | #53 | Exceptional 94.0% |
| Immigrants | North America | 99.9 /100 | #54 | Exceptional 94.0% |
| Czechoslovakians | 99.9 /100 | #55 | Exceptional 94.0% |
| French Canadians | 99.9 /100 | #56 | Exceptional 94.0% |
| New Zealanders | 99.9 /100 | #57 | Exceptional 94.0% |
| Iranians | 99.9 /100 | #58 | Exceptional 94.0% |