American vs Potawatomi Married-couple Households
COMPARE
American
Potawatomi
Married-couple Households
Married-couple Households Comparison
Americans
Potawatomi
47.9%
MARRIED-COUPLE HOUSEHOLDS
96.9/ 100
METRIC RATING
94th/ 347
METRIC RANK
45.7%
MARRIED-COUPLE HOUSEHOLDS
15.6/ 100
METRIC RATING
200th/ 347
METRIC RANK
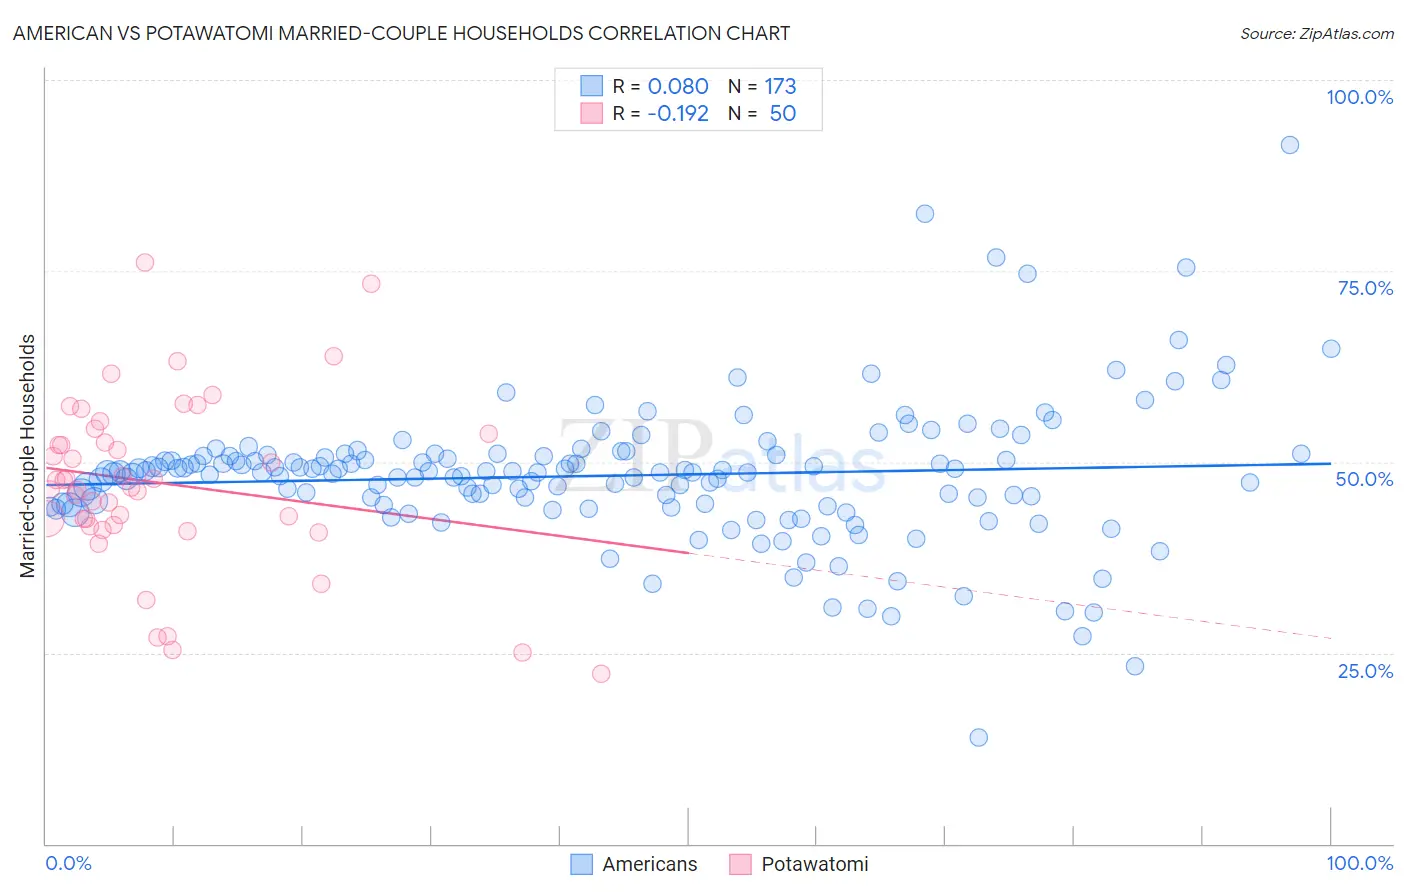
American vs Potawatomi Married-couple Households Correlation Chart
The statistical analysis conducted on geographies consisting of 581,345,567 people shows a slight positive correlation between the proportion of Americans and percentage of married-couple family households in the United States with a correlation coefficient (R) of 0.080 and weighted average of 47.9%. Similarly, the statistical analysis conducted on geographies consisting of 117,759,864 people shows a poor negative correlation between the proportion of Potawatomi and percentage of married-couple family households in the United States with a correlation coefficient (R) of -0.192 and weighted average of 45.7%, a difference of 4.9%.
Married-couple Households Correlation Summary
| Measurement | American | Potawatomi |
| Minimum | 14.0% | 22.2% |
| Maximum | 91.6% | 76.1% |
| Range | 77.6% | 53.9% |
| Mean | 48.2% | 47.2% |
| Median | 48.6% | 47.1% |
| Interquartile 25% (IQ1) | 44.4% | 41.8% |
| Interquartile 75% (IQ3) | 50.8% | 53.7% |
| Interquartile Range (IQR) | 6.4% | 11.9% |
| Standard Deviation (Sample) | 9.2% | 11.3% |
| Standard Deviation (Population) | 9.2% | 11.2% |
Similar Demographics by Married-couple Households
Demographics Similar to Americans by Married-couple Households
In terms of married-couple households, the demographic groups most similar to Americans are Lebanese (47.9%, a difference of 0.0%), Palestinian (48.0%, a difference of 0.020%), Immigrants from Belgium (47.9%, a difference of 0.030%), Immigrants from Moldova (48.0%, a difference of 0.040%), and Immigrants from Egypt (47.9%, a difference of 0.080%).
| Demographics | Rating | Rank | Married-couple Households |
| Immigrants | Ireland | 97.3 /100 | #87 | Exceptional 48.0% |
| Afghans | 97.3 /100 | #88 | Exceptional 48.0% |
| Cypriots | 97.2 /100 | #89 | Exceptional 48.0% |
| French | 97.2 /100 | #90 | Exceptional 48.0% |
| Immigrants | Moldova | 97.0 /100 | #91 | Exceptional 48.0% |
| Palestinians | 96.9 /100 | #92 | Exceptional 48.0% |
| Lebanese | 96.9 /100 | #93 | Exceptional 47.9% |
| Americans | 96.9 /100 | #94 | Exceptional 47.9% |
| Immigrants | Belgium | 96.8 /100 | #95 | Exceptional 47.9% |
| Immigrants | Egypt | 96.6 /100 | #96 | Exceptional 47.9% |
| Latvians | 96.5 /100 | #97 | Exceptional 47.9% |
| Immigrants | North Macedonia | 96.4 /100 | #98 | Exceptional 47.9% |
| Immigrants | Austria | 96.4 /100 | #99 | Exceptional 47.9% |
| Immigrants | Italy | 96.3 /100 | #100 | Exceptional 47.9% |
| Turks | 96.1 /100 | #101 | Exceptional 47.8% |
Demographics Similar to Potawatomi by Married-couple Households
In terms of married-couple households, the demographic groups most similar to Potawatomi are Carpatho Rusyn (45.7%, a difference of 0.010%), Immigrants from Serbia (45.7%, a difference of 0.030%), Immigrants from Central America (45.7%, a difference of 0.11%), Alaska Native (45.6%, a difference of 0.20%), and Ottawa (45.8%, a difference of 0.25%).
| Demographics | Rating | Rank | Married-couple Households |
| Taiwanese | 23.4 /100 | #193 | Fair 45.9% |
| Mexican American Indians | 23.3 /100 | #194 | Fair 45.9% |
| Chickasaw | 22.7 /100 | #195 | Fair 45.9% |
| Immigrants | South America | 22.2 /100 | #196 | Fair 45.9% |
| Cambodians | 21.3 /100 | #197 | Fair 45.9% |
| Ottawa | 19.4 /100 | #198 | Poor 45.8% |
| Carpatho Rusyns | 15.7 /100 | #199 | Poor 45.7% |
| Potawatomi | 15.6 /100 | #200 | Poor 45.7% |
| Immigrants | Serbia | 15.2 /100 | #201 | Poor 45.7% |
| Immigrants | Central America | 14.2 /100 | #202 | Poor 45.7% |
| Alaska Natives | 13.0 /100 | #203 | Poor 45.6% |
| Aleuts | 12.5 /100 | #204 | Poor 45.6% |
| Nepalese | 11.9 /100 | #205 | Poor 45.6% |
| Uruguayans | 10.4 /100 | #206 | Poor 45.5% |
| Immigrants | France | 8.8 /100 | #207 | Tragic 45.4% |