Immigrants from Iran vs Immigrants from Lithuania Currently Married
COMPARE
Immigrants from Iran
Immigrants from Lithuania
Currently Married
Currently Married Comparison
Immigrants from Iran
Immigrants from Lithuania
48.7%
CURRENTLY MARRIED
99.2/ 100
METRIC RATING
46th/ 347
METRIC RANK
48.8%
CURRENTLY MARRIED
99.4/ 100
METRIC RATING
34th/ 347
METRIC RANK
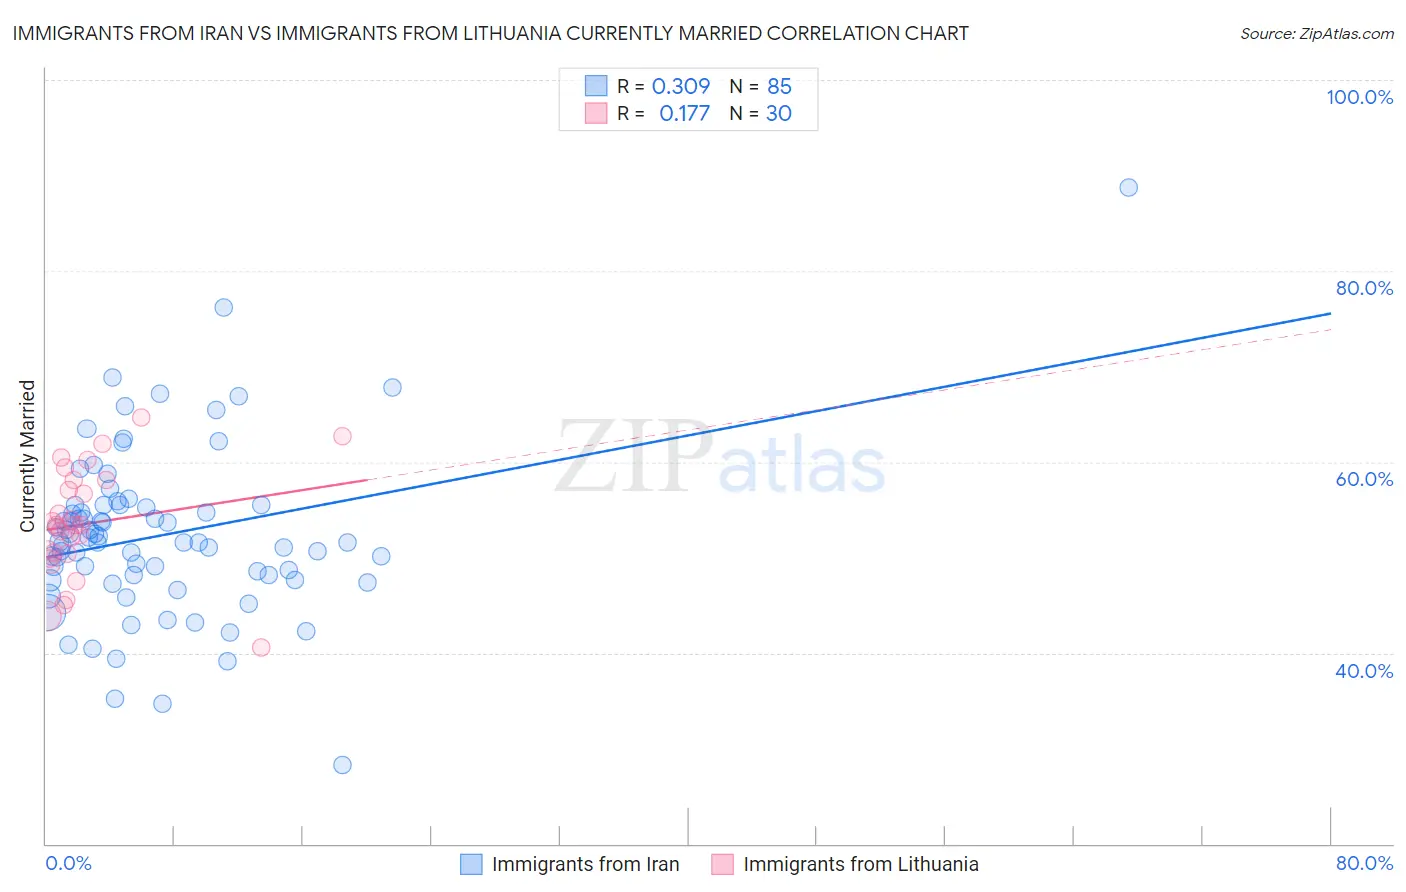
Immigrants from Iran vs Immigrants from Lithuania Currently Married Correlation Chart
The statistical analysis conducted on geographies consisting of 279,835,322 people shows a mild positive correlation between the proportion of Immigrants from Iran and percentage of population currently married in the United States with a correlation coefficient (R) of 0.309 and weighted average of 48.7%. Similarly, the statistical analysis conducted on geographies consisting of 117,724,932 people shows a poor positive correlation between the proportion of Immigrants from Lithuania and percentage of population currently married in the United States with a correlation coefficient (R) of 0.177 and weighted average of 48.8%, a difference of 0.28%.
Currently Married Correlation Summary
| Measurement | Immigrants from Iran | Immigrants from Lithuania |
| Minimum | 28.3% | 40.5% |
| Maximum | 88.7% | 64.7% |
| Range | 60.4% | 24.2% |
| Mean | 52.3% | 53.5% |
| Median | 51.6% | 53.4% |
| Interquartile 25% (IQ1) | 47.9% | 50.4% |
| Interquartile 75% (IQ3) | 55.5% | 58.1% |
| Interquartile Range (IQR) | 7.6% | 7.8% |
| Standard Deviation (Sample) | 8.9% | 5.8% |
| Standard Deviation (Population) | 8.8% | 5.7% |
Demographics Similar to Immigrants from Iran and Immigrants from Lithuania by Currently Married
In terms of currently married, the demographic groups most similar to Immigrants from Iran are Northern European (48.7%, a difference of 0.010%), Austrian (48.7%, a difference of 0.020%), Belgian (48.7%, a difference of 0.030%), Immigrants from North America (48.7%, a difference of 0.060%), and Finnish (48.8%, a difference of 0.090%). Similarly, the demographic groups most similar to Immigrants from Lithuania are Immigrants from Northern Europe (48.8%, a difference of 0.020%), Italian (48.8%, a difference of 0.030%), Hungarian (48.8%, a difference of 0.030%), Irish (48.9%, a difference of 0.060%), and Czechoslovakian (48.8%, a difference of 0.070%).
| Demographics | Rating | Rank | Currently Married |
| Eastern Europeans | 99.5 /100 | #30 | Exceptional 48.9% |
| Poles | 99.5 /100 | #31 | Exceptional 48.9% |
| Immigrants | Hong Kong | 99.5 /100 | #32 | Exceptional 48.9% |
| Irish | 99.5 /100 | #33 | Exceptional 48.9% |
| Immigrants | Lithuania | 99.4 /100 | #34 | Exceptional 48.8% |
| Immigrants | Northern Europe | 99.4 /100 | #35 | Exceptional 48.8% |
| Italians | 99.4 /100 | #36 | Exceptional 48.8% |
| Hungarians | 99.4 /100 | #37 | Exceptional 48.8% |
| Czechoslovakians | 99.4 /100 | #38 | Exceptional 48.8% |
| British | 99.4 /100 | #39 | Exceptional 48.8% |
| Immigrants | Canada | 99.4 /100 | #40 | Exceptional 48.8% |
| Greeks | 99.3 /100 | #41 | Exceptional 48.8% |
| Finns | 99.3 /100 | #42 | Exceptional 48.8% |
| Scotch-Irish | 99.3 /100 | #43 | Exceptional 48.7% |
| Immigrants | North America | 99.3 /100 | #44 | Exceptional 48.7% |
| Belgians | 99.3 /100 | #45 | Exceptional 48.7% |
| Immigrants | Iran | 99.2 /100 | #46 | Exceptional 48.7% |
| Northern Europeans | 99.2 /100 | #47 | Exceptional 48.7% |
| Austrians | 99.2 /100 | #48 | Exceptional 48.7% |
| Bhutanese | 99.1 /100 | #49 | Exceptional 48.6% |
| Iranians | 99.0 /100 | #50 | Exceptional 48.6% |