Palestinian vs Immigrants from Lithuania Currently Married
COMPARE
Palestinian
Immigrants from Lithuania
Currently Married
Currently Married Comparison
Palestinians
Immigrants from Lithuania
47.6%
CURRENTLY MARRIED
90.4/ 100
METRIC RATING
116th/ 347
METRIC RANK
48.8%
CURRENTLY MARRIED
99.4/ 100
METRIC RATING
34th/ 347
METRIC RANK
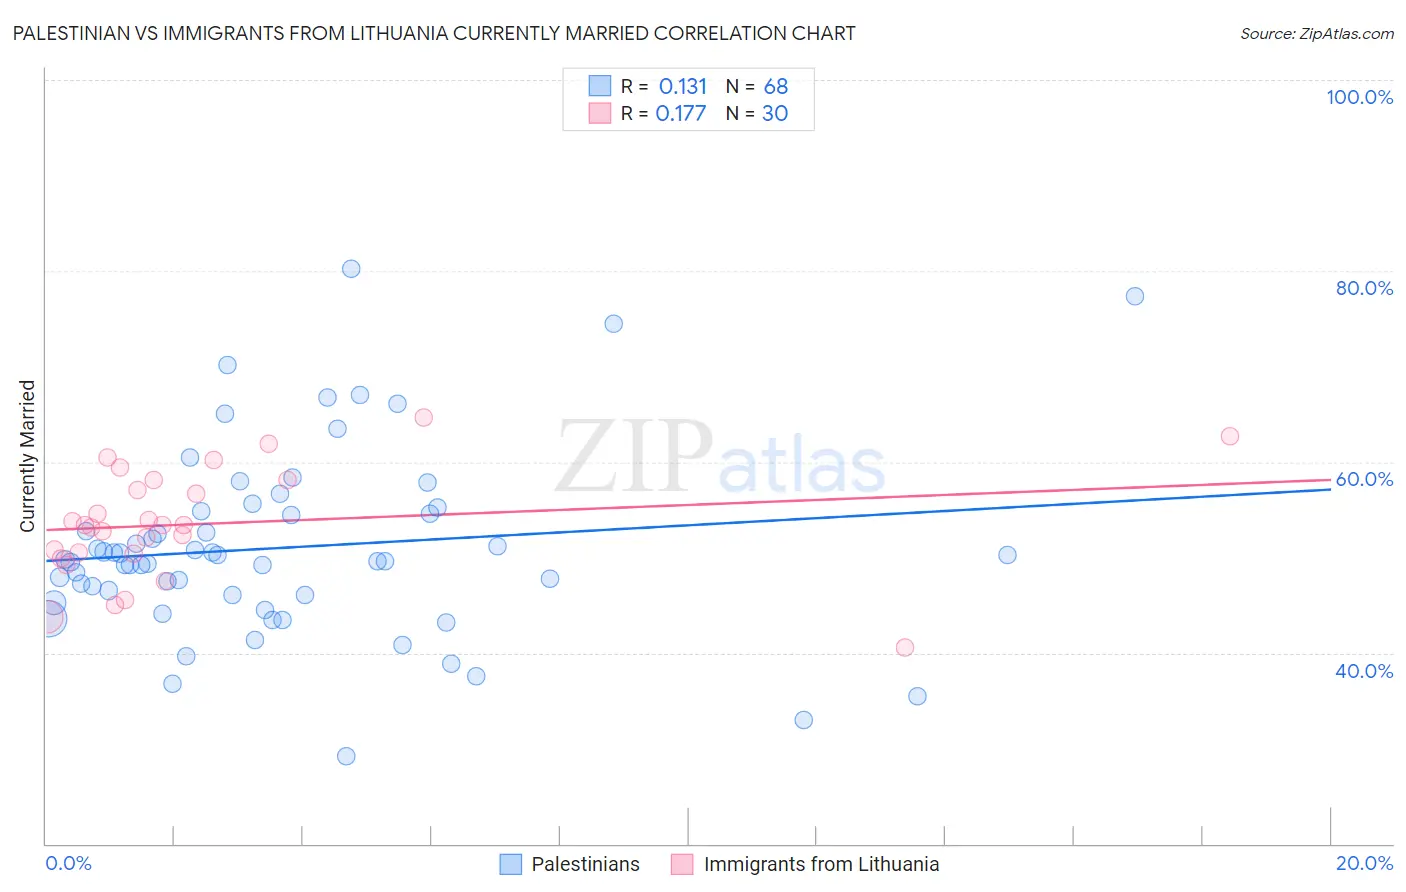
Palestinian vs Immigrants from Lithuania Currently Married Correlation Chart
The statistical analysis conducted on geographies consisting of 216,437,079 people shows a poor positive correlation between the proportion of Palestinians and percentage of population currently married in the United States with a correlation coefficient (R) of 0.131 and weighted average of 47.6%. Similarly, the statistical analysis conducted on geographies consisting of 117,724,932 people shows a poor positive correlation between the proportion of Immigrants from Lithuania and percentage of population currently married in the United States with a correlation coefficient (R) of 0.177 and weighted average of 48.8%, a difference of 2.6%.
Currently Married Correlation Summary
| Measurement | Palestinian | Immigrants from Lithuania |
| Minimum | 29.1% | 40.5% |
| Maximum | 80.2% | 64.7% |
| Range | 51.1% | 24.2% |
| Mean | 51.0% | 53.5% |
| Median | 49.7% | 53.4% |
| Interquartile 25% (IQ1) | 46.0% | 50.4% |
| Interquartile 75% (IQ3) | 54.7% | 58.1% |
| Interquartile Range (IQR) | 8.7% | 7.8% |
| Standard Deviation (Sample) | 9.7% | 5.8% |
| Standard Deviation (Population) | 9.7% | 5.7% |
Similar Demographics by Currently Married
Demographics Similar to Palestinians by Currently Married
In terms of currently married, the demographic groups most similar to Palestinians are South African (47.6%, a difference of 0.010%), Immigrants from Indonesia (47.6%, a difference of 0.010%), Puget Sound Salish (47.6%, a difference of 0.020%), Immigrants from Philippines (47.6%, a difference of 0.020%), and Australian (47.6%, a difference of 0.020%).
| Demographics | Rating | Rank | Currently Married |
| Immigrants | Egypt | 92.3 /100 | #109 | Exceptional 47.7% |
| Immigrants | Russia | 92.0 /100 | #110 | Exceptional 47.7% |
| Immigrants | Hungary | 91.2 /100 | #111 | Exceptional 47.6% |
| Immigrants | Western Europe | 91.1 /100 | #112 | Exceptional 47.6% |
| Immigrants | Denmark | 90.9 /100 | #113 | Exceptional 47.6% |
| South Africans | 90.5 /100 | #114 | Exceptional 47.6% |
| Immigrants | Indonesia | 90.5 /100 | #115 | Exceptional 47.6% |
| Palestinians | 90.4 /100 | #116 | Exceptional 47.6% |
| Puget Sound Salish | 90.3 /100 | #117 | Exceptional 47.6% |
| Immigrants | Philippines | 90.2 /100 | #118 | Exceptional 47.6% |
| Australians | 90.2 /100 | #119 | Exceptional 47.6% |
| Syrians | 88.9 /100 | #120 | Excellent 47.5% |
| Immigrants | Croatia | 88.6 /100 | #121 | Excellent 47.5% |
| Osage | 87.9 /100 | #122 | Excellent 47.5% |
| Immigrants | Kazakhstan | 87.2 /100 | #123 | Excellent 47.4% |
Demographics Similar to Immigrants from Lithuania by Currently Married
In terms of currently married, the demographic groups most similar to Immigrants from Lithuania are Immigrants from Northern Europe (48.8%, a difference of 0.020%), Italian (48.8%, a difference of 0.030%), Hungarian (48.8%, a difference of 0.030%), Irish (48.9%, a difference of 0.060%), and Czechoslovakian (48.8%, a difference of 0.070%).
| Demographics | Rating | Rank | Currently Married |
| Burmese | 99.6 /100 | #27 | Exceptional 48.9% |
| Welsh | 99.5 /100 | #28 | Exceptional 48.9% |
| Croatians | 99.5 /100 | #29 | Exceptional 48.9% |
| Eastern Europeans | 99.5 /100 | #30 | Exceptional 48.9% |
| Poles | 99.5 /100 | #31 | Exceptional 48.9% |
| Immigrants | Hong Kong | 99.5 /100 | #32 | Exceptional 48.9% |
| Irish | 99.5 /100 | #33 | Exceptional 48.9% |
| Immigrants | Lithuania | 99.4 /100 | #34 | Exceptional 48.8% |
| Immigrants | Northern Europe | 99.4 /100 | #35 | Exceptional 48.8% |
| Italians | 99.4 /100 | #36 | Exceptional 48.8% |
| Hungarians | 99.4 /100 | #37 | Exceptional 48.8% |
| Czechoslovakians | 99.4 /100 | #38 | Exceptional 48.8% |
| British | 99.4 /100 | #39 | Exceptional 48.8% |
| Immigrants | Canada | 99.4 /100 | #40 | Exceptional 48.8% |
| Greeks | 99.3 /100 | #41 | Exceptional 48.8% |