Panamanian vs Indian (Asian) Bachelor's Degree
COMPARE
Panamanian
Indian (Asian)
Bachelor's Degree
Bachelor's Degree Comparison
Panamanians
Indians (Asian)
36.5%
BACHELOR'S DEGREE
18.8/ 100
METRIC RATING
209th/ 347
METRIC RANK
47.4%
BACHELOR'S DEGREE
100.0/ 100
METRIC RATING
18th/ 347
METRIC RANK
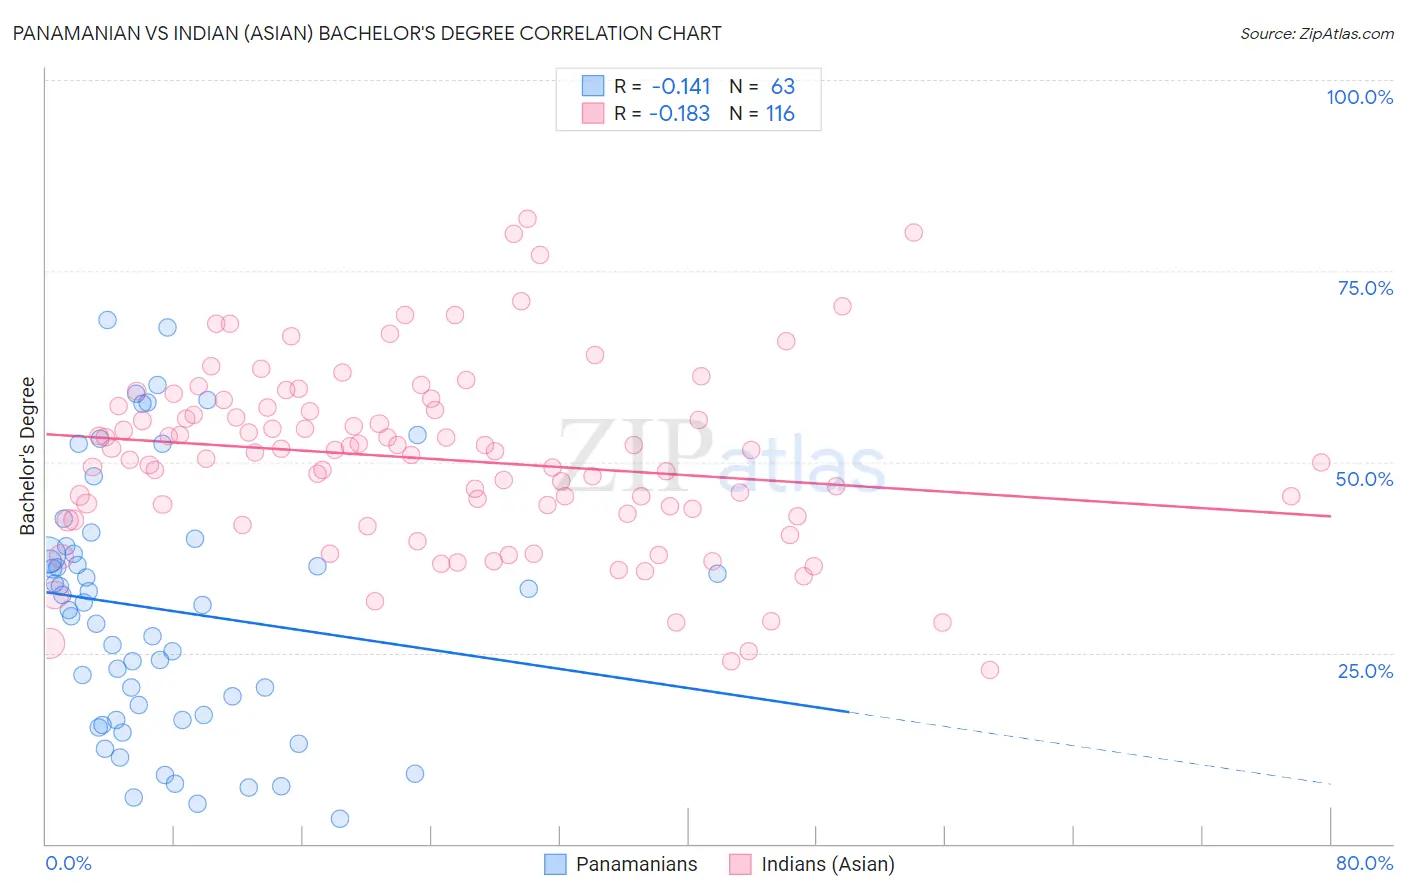
Panamanian vs Indian (Asian) Bachelor's Degree Correlation Chart
The statistical analysis conducted on geographies consisting of 281,235,018 people shows a poor negative correlation between the proportion of Panamanians and percentage of population with at least bachelor's degree education in the United States with a correlation coefficient (R) of -0.141 and weighted average of 36.5%. Similarly, the statistical analysis conducted on geographies consisting of 495,247,229 people shows a poor negative correlation between the proportion of Indians (Asian) and percentage of population with at least bachelor's degree education in the United States with a correlation coefficient (R) of -0.183 and weighted average of 47.4%, a difference of 30.1%.
Bachelor's Degree Correlation Summary
| Measurement | Panamanian | Indian (Asian) |
| Minimum | 3.2% | 22.8% |
| Maximum | 68.6% | 81.8% |
| Range | 65.4% | 59.0% |
| Mean | 30.7% | 50.4% |
| Median | 31.3% | 51.3% |
| Interquartile 25% (IQ1) | 16.2% | 43.1% |
| Interquartile 75% (IQ3) | 38.9% | 56.9% |
| Interquartile Range (IQR) | 22.7% | 13.9% |
| Standard Deviation (Sample) | 16.7% | 11.9% |
| Standard Deviation (Population) | 16.6% | 11.9% |
Similar Demographics by Bachelor's Degree
Demographics Similar to Panamanians by Bachelor's Degree
In terms of bachelor's degree, the demographic groups most similar to Panamanians are French (36.5%, a difference of 0.030%), Scotch-Irish (36.4%, a difference of 0.080%), Immigrants from Thailand (36.5%, a difference of 0.10%), Immigrants from Philippines (36.4%, a difference of 0.16%), and Immigrants from Middle Africa (36.6%, a difference of 0.30%).
| Demographics | Rating | Rank | Bachelor's Degree |
| Immigrants | Zaire | 25.3 /100 | #202 | Fair 36.8% |
| Immigrants | Nigeria | 23.1 /100 | #203 | Fair 36.7% |
| Immigrants | Immigrants | 22.8 /100 | #204 | Fair 36.7% |
| Finns | 22.2 /100 | #205 | Fair 36.7% |
| Spaniards | 21.2 /100 | #206 | Fair 36.6% |
| Immigrants | Middle Africa | 20.6 /100 | #207 | Fair 36.6% |
| Immigrants | Thailand | 19.4 /100 | #208 | Poor 36.5% |
| Panamanians | 18.8 /100 | #209 | Poor 36.5% |
| French | 18.6 /100 | #210 | Poor 36.5% |
| Scotch-Irish | 18.3 /100 | #211 | Poor 36.4% |
| Immigrants | Philippines | 17.8 /100 | #212 | Poor 36.4% |
| Immigrants | Panama | 14.2 /100 | #213 | Poor 36.2% |
| Germans | 13.9 /100 | #214 | Poor 36.1% |
| Immigrants | Western Africa | 13.8 /100 | #215 | Poor 36.1% |
| Barbadians | 13.5 /100 | #216 | Poor 36.1% |
Demographics Similar to Indians (Asian) by Bachelor's Degree
In terms of bachelor's degree, the demographic groups most similar to Indians (Asian) are Eastern European (47.5%, a difference of 0.15%), Cambodian (47.2%, a difference of 0.43%), Immigrants from Switzerland (47.1%, a difference of 0.65%), Immigrants from Ireland (47.1%, a difference of 0.66%), and Immigrants from Belgium (47.0%, a difference of 0.86%).
| Demographics | Rating | Rank | Bachelor's Degree |
| Immigrants | Australia | 100.0 /100 | #11 | Exceptional 48.5% |
| Immigrants | China | 100.0 /100 | #12 | Exceptional 48.4% |
| Immigrants | South Central Asia | 100.0 /100 | #13 | Exceptional 48.3% |
| Immigrants | Hong Kong | 100.0 /100 | #14 | Exceptional 48.2% |
| Immigrants | Eastern Asia | 100.0 /100 | #15 | Exceptional 48.1% |
| Soviet Union | 100.0 /100 | #16 | Exceptional 47.9% |
| Eastern Europeans | 100.0 /100 | #17 | Exceptional 47.5% |
| Indians (Asian) | 100.0 /100 | #18 | Exceptional 47.4% |
| Cambodians | 100.0 /100 | #19 | Exceptional 47.2% |
| Immigrants | Switzerland | 100.0 /100 | #20 | Exceptional 47.1% |
| Immigrants | Ireland | 100.0 /100 | #21 | Exceptional 47.1% |
| Immigrants | Belgium | 100.0 /100 | #22 | Exceptional 47.0% |
| Immigrants | Sweden | 100.0 /100 | #23 | Exceptional 47.0% |
| Immigrants | Korea | 100.0 /100 | #24 | Exceptional 47.0% |
| Burmese | 100.0 /100 | #25 | Exceptional 46.9% |