Palestinian vs West Indian Average Family Size
COMPARE
Palestinian
West Indian
Average Family Size
Average Family Size Comparison
Palestinians
West Indians
3.23
AVERAGE FAMILY SIZE
46.6/ 100
METRIC RATING
180th/ 347
METRIC RANK
3.29
AVERAGE FAMILY SIZE
98.5/ 100
METRIC RATING
102nd/ 347
METRIC RANK
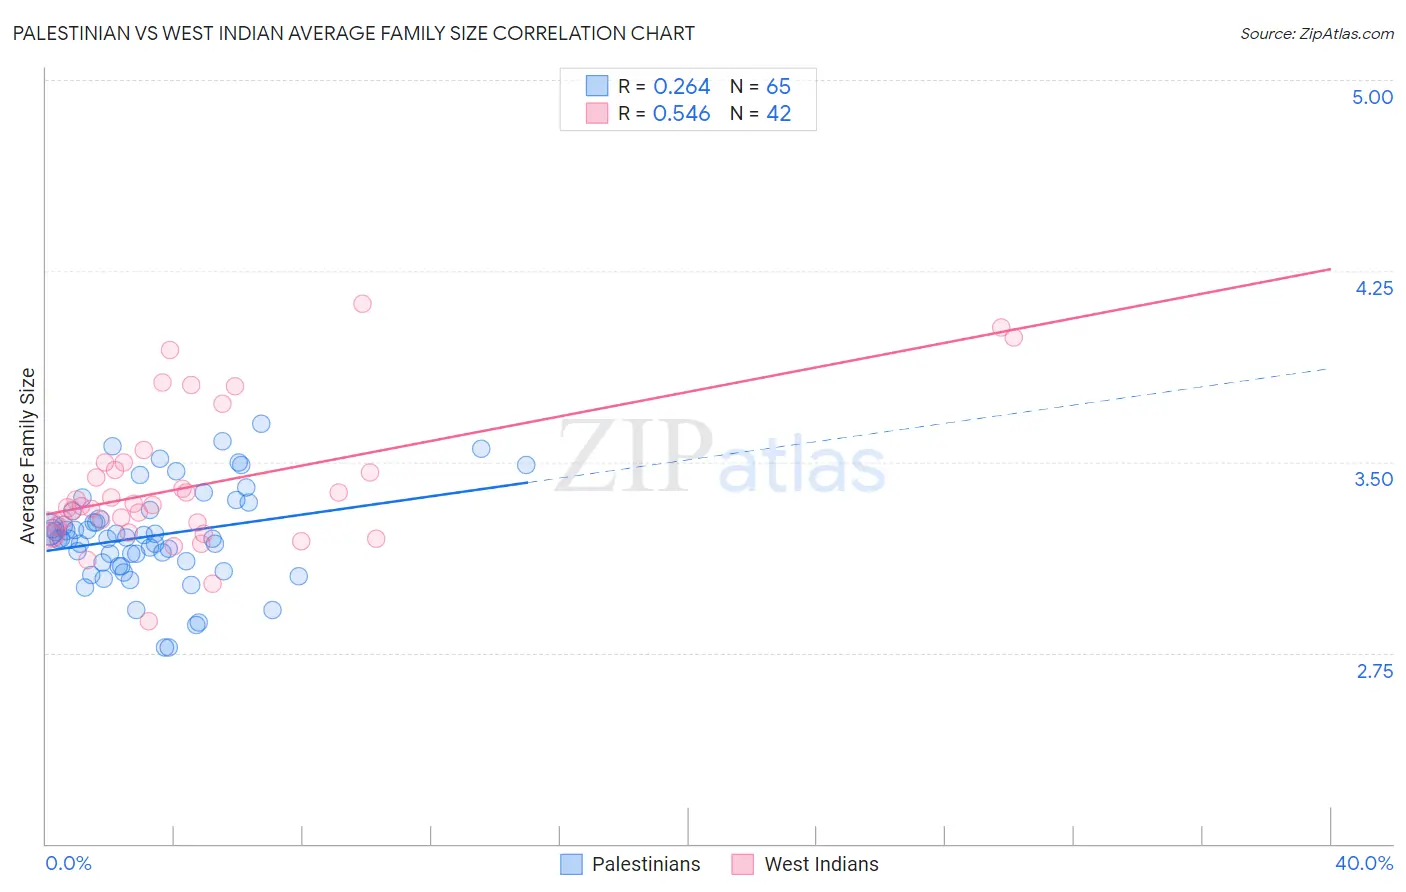
Palestinian vs West Indian Average Family Size Correlation Chart
The statistical analysis conducted on geographies consisting of 216,402,658 people shows a weak positive correlation between the proportion of Palestinians and average family size in the United States with a correlation coefficient (R) of 0.264 and weighted average of 3.23. Similarly, the statistical analysis conducted on geographies consisting of 253,859,351 people shows a substantial positive correlation between the proportion of West Indians and average family size in the United States with a correlation coefficient (R) of 0.546 and weighted average of 3.29, a difference of 2.0%.
Average Family Size Correlation Summary
| Measurement | Palestinian | West Indian |
| Minimum | 2.77 | 2.87 |
| Maximum | 3.65 | 4.12 |
| Range | 0.88 | 1.25 |
| Mean | 3.21 | 3.41 |
| Median | 3.20 | 3.33 |
| Interquartile 25% (IQ1) | 3.10 | 3.23 |
| Interquartile 75% (IQ3) | 3.31 | 3.50 |
| Interquartile Range (IQR) | 0.21 | 0.26 |
| Standard Deviation (Sample) | 0.19 | 0.28 |
| Standard Deviation (Population) | 0.19 | 0.27 |
Similar Demographics by Average Family Size
Demographics Similar to Palestinians by Average Family Size
In terms of average family size, the demographic groups most similar to Palestinians are Argentinean (3.23, a difference of 0.010%), Spaniard (3.23, a difference of 0.010%), Immigrants from Korea (3.23, a difference of 0.010%), Spanish (3.23, a difference of 0.030%), and Israeli (3.23, a difference of 0.040%).
| Demographics | Rating | Rank | Average Family Size |
| Immigrants | Uruguay | 52.0 /100 | #173 | Average 3.23 |
| Immigrants | South Central Asia | 50.0 /100 | #174 | Average 3.23 |
| Immigrants | China | 49.9 /100 | #175 | Average 3.23 |
| Israelis | 48.7 /100 | #176 | Average 3.23 |
| Argentineans | 47.4 /100 | #177 | Average 3.23 |
| Spaniards | 47.2 /100 | #178 | Average 3.23 |
| Immigrants | Korea | 46.9 /100 | #179 | Average 3.23 |
| Palestinians | 46.6 /100 | #180 | Average 3.23 |
| Spanish | 44.8 /100 | #181 | Average 3.23 |
| Moroccans | 44.2 /100 | #182 | Average 3.22 |
| Immigrants | Northern Africa | 41.7 /100 | #183 | Average 3.22 |
| Immigrants | Eastern Asia | 40.8 /100 | #184 | Average 3.22 |
| Immigrants | Sri Lanka | 39.8 /100 | #185 | Fair 3.22 |
| Immigrants | Argentina | 39.8 /100 | #186 | Fair 3.22 |
| Immigrants | Malaysia | 39.0 /100 | #187 | Fair 3.22 |
Demographics Similar to West Indians by Average Family Size
In terms of average family size, the demographic groups most similar to West Indians are Immigrants from Burma/Myanmar (3.29, a difference of 0.010%), Guamanian/Chamorro (3.29, a difference of 0.020%), Barbadian (3.29, a difference of 0.030%), Nigerian (3.29, a difference of 0.030%), and Immigrants from Western Africa (3.29, a difference of 0.030%).
| Demographics | Rating | Rank | Average Family Size |
| Immigrants | Lebanon | 99.0 /100 | #95 | Exceptional 3.30 |
| U.S. Virgin Islanders | 98.8 /100 | #96 | Exceptional 3.29 |
| Immigrants | Oceania | 98.7 /100 | #97 | Exceptional 3.29 |
| Barbadians | 98.6 /100 | #98 | Exceptional 3.29 |
| Nigerians | 98.6 /100 | #99 | Exceptional 3.29 |
| Guamanians/Chamorros | 98.6 /100 | #100 | Exceptional 3.29 |
| Immigrants | Burma/Myanmar | 98.6 /100 | #101 | Exceptional 3.29 |
| West Indians | 98.5 /100 | #102 | Exceptional 3.29 |
| Immigrants | Western Africa | 98.4 /100 | #103 | Exceptional 3.29 |
| Bolivians | 98.3 /100 | #104 | Exceptional 3.29 |
| Immigrants | Ghana | 98.1 /100 | #105 | Exceptional 3.29 |
| Paiute | 98.0 /100 | #106 | Exceptional 3.29 |
| Ghanaians | 98.0 /100 | #107 | Exceptional 3.29 |
| Asians | 97.0 /100 | #108 | Exceptional 3.28 |
| Puerto Ricans | 96.7 /100 | #109 | Exceptional 3.28 |