Palestinian vs Israeli Average Family Size
COMPARE
Palestinian
Israeli
Average Family Size
Average Family Size Comparison
Palestinians
Israelis
3.23
AVERAGE FAMILY SIZE
46.6/ 100
METRIC RATING
180th/ 347
METRIC RANK
3.23
AVERAGE FAMILY SIZE
48.7/ 100
METRIC RATING
176th/ 347
METRIC RANK
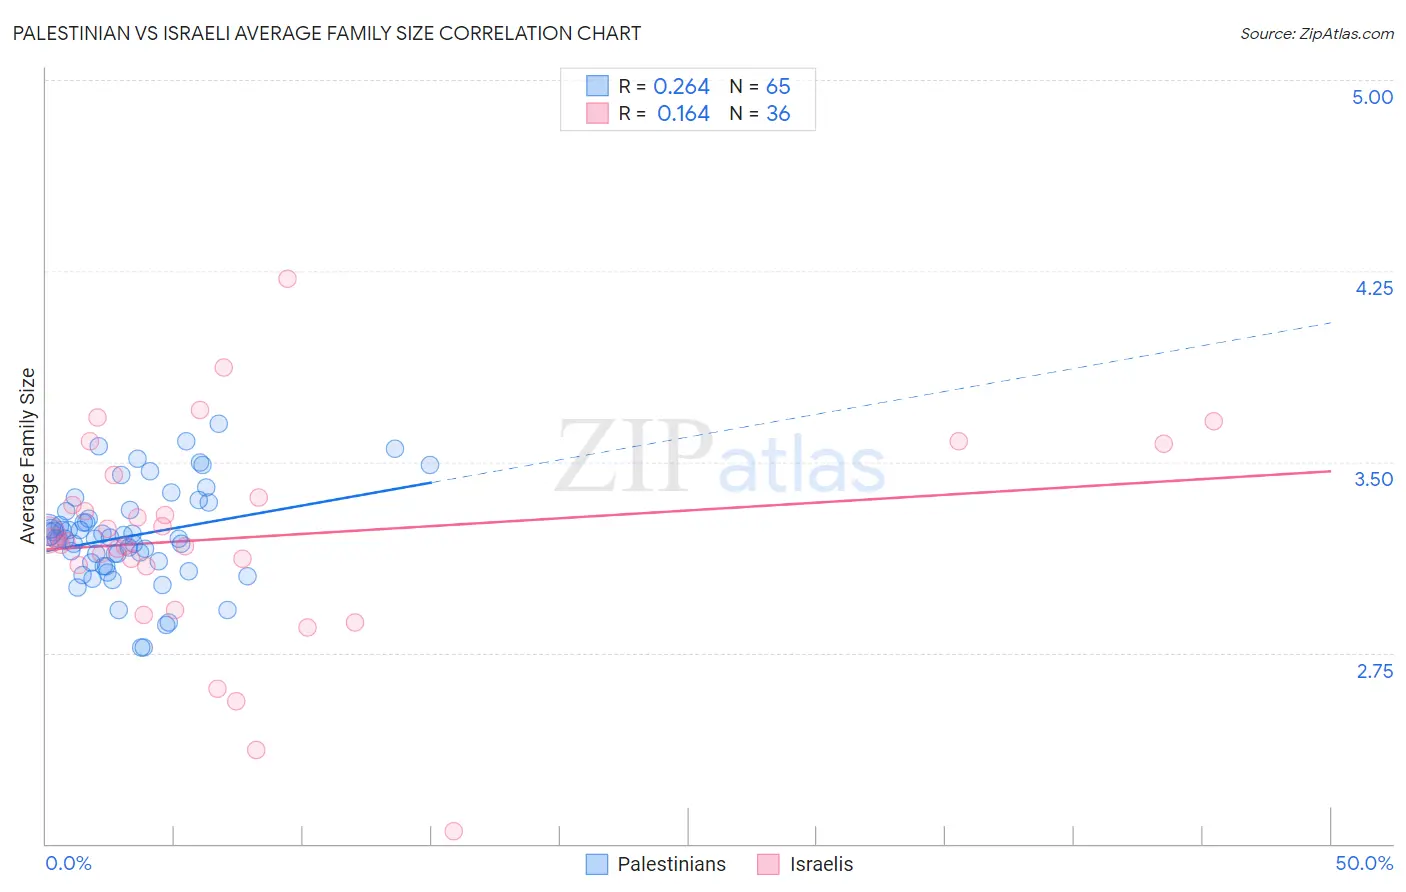
Palestinian vs Israeli Average Family Size Correlation Chart
The statistical analysis conducted on geographies consisting of 216,402,658 people shows a weak positive correlation between the proportion of Palestinians and average family size in the United States with a correlation coefficient (R) of 0.264 and weighted average of 3.23. Similarly, the statistical analysis conducted on geographies consisting of 211,000,006 people shows a poor positive correlation between the proportion of Israelis and average family size in the United States with a correlation coefficient (R) of 0.164 and weighted average of 3.23, a difference of 0.040%.
Average Family Size Correlation Summary
| Measurement | Palestinian | Israeli |
| Minimum | 2.77 | 2.05 |
| Maximum | 3.65 | 4.22 |
| Range | 0.88 | 2.17 |
| Mean | 3.21 | 3.20 |
| Median | 3.20 | 3.20 |
| Interquartile 25% (IQ1) | 3.10 | 3.09 |
| Interquartile 75% (IQ3) | 3.31 | 3.40 |
| Interquartile Range (IQR) | 0.21 | 0.31 |
| Standard Deviation (Sample) | 0.19 | 0.41 |
| Standard Deviation (Population) | 0.19 | 0.41 |
Demographics Similar to Palestinians and Israelis by Average Family Size
In terms of average family size, the demographic groups most similar to Palestinians are Argentinean (3.23, a difference of 0.010%), Spaniard (3.23, a difference of 0.010%), Immigrants from Korea (3.23, a difference of 0.010%), Spanish (3.23, a difference of 0.030%), and Moroccan (3.22, a difference of 0.040%). Similarly, the demographic groups most similar to Israelis are Immigrants from South Central Asia (3.23, a difference of 0.020%), Immigrants from China (3.23, a difference of 0.020%), Argentinean (3.23, a difference of 0.020%), Spaniard (3.23, a difference of 0.030%), and Immigrants from Korea (3.23, a difference of 0.030%).
| Demographics | Rating | Rank | Average Family Size |
| Taiwanese | 54.2 /100 | #168 | Average 3.23 |
| Aleuts | 54.1 /100 | #169 | Average 3.23 |
| Arabs | 53.8 /100 | #170 | Average 3.23 |
| Chileans | 53.2 /100 | #171 | Average 3.23 |
| Immigrants | Congo | 52.7 /100 | #172 | Average 3.23 |
| Immigrants | Uruguay | 52.0 /100 | #173 | Average 3.23 |
| Immigrants | South Central Asia | 50.0 /100 | #174 | Average 3.23 |
| Immigrants | China | 49.9 /100 | #175 | Average 3.23 |
| Israelis | 48.7 /100 | #176 | Average 3.23 |
| Argentineans | 47.4 /100 | #177 | Average 3.23 |
| Spaniards | 47.2 /100 | #178 | Average 3.23 |
| Immigrants | Korea | 46.9 /100 | #179 | Average 3.23 |
| Palestinians | 46.6 /100 | #180 | Average 3.23 |
| Spanish | 44.8 /100 | #181 | Average 3.23 |
| Moroccans | 44.2 /100 | #182 | Average 3.22 |
| Immigrants | Northern Africa | 41.7 /100 | #183 | Average 3.22 |
| Immigrants | Eastern Asia | 40.8 /100 | #184 | Average 3.22 |
| Immigrants | Sri Lanka | 39.8 /100 | #185 | Fair 3.22 |
| Immigrants | Argentina | 39.8 /100 | #186 | Fair 3.22 |
| Immigrants | Malaysia | 39.0 /100 | #187 | Fair 3.22 |
| Thais | 38.3 /100 | #188 | Fair 3.22 |