Palestinian vs Immigrants from Chile Average Family Size
COMPARE
Palestinian
Immigrants from Chile
Average Family Size
Average Family Size Comparison
Palestinians
Immigrants from Chile
3.23
AVERAGE FAMILY SIZE
46.6/ 100
METRIC RATING
180th/ 347
METRIC RANK
3.24
AVERAGE FAMILY SIZE
63.2/ 100
METRIC RATING
161st/ 347
METRIC RANK
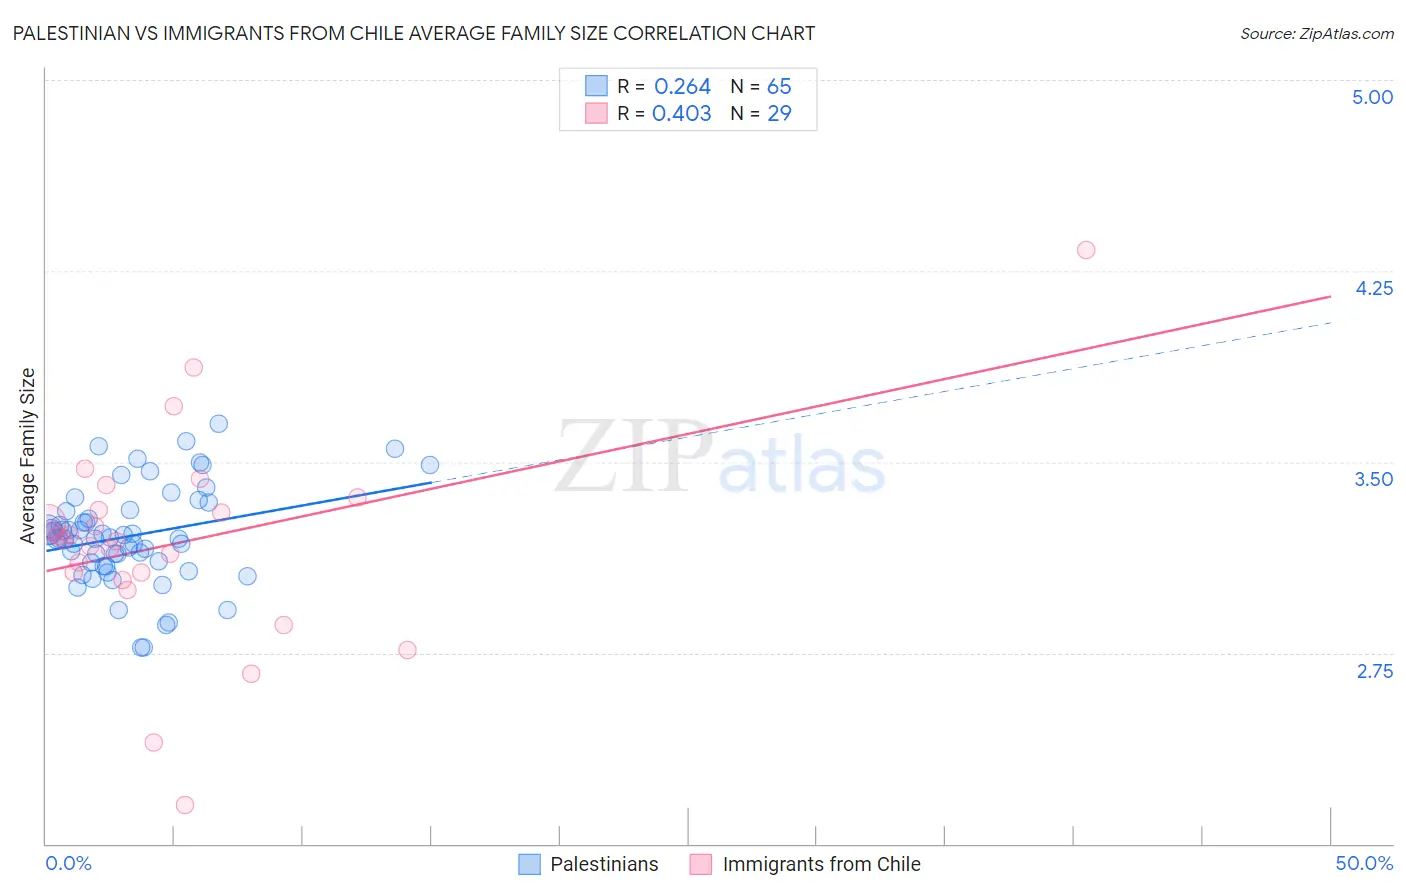
Palestinian vs Immigrants from Chile Average Family Size Correlation Chart
The statistical analysis conducted on geographies consisting of 216,402,658 people shows a weak positive correlation between the proportion of Palestinians and average family size in the United States with a correlation coefficient (R) of 0.264 and weighted average of 3.23. Similarly, the statistical analysis conducted on geographies consisting of 218,601,267 people shows a moderate positive correlation between the proportion of Immigrants from Chile and average family size in the United States with a correlation coefficient (R) of 0.403 and weighted average of 3.24, a difference of 0.31%.
Average Family Size Correlation Summary
| Measurement | Palestinian | Immigrants from Chile |
| Minimum | 2.77 | 2.15 |
| Maximum | 3.65 | 4.33 |
| Range | 0.88 | 2.18 |
| Mean | 3.21 | 3.18 |
| Median | 3.20 | 3.19 |
| Interquartile 25% (IQ1) | 3.10 | 3.05 |
| Interquartile 75% (IQ3) | 3.31 | 3.34 |
| Interquartile Range (IQR) | 0.21 | 0.29 |
| Standard Deviation (Sample) | 0.19 | 0.41 |
| Standard Deviation (Population) | 0.19 | 0.40 |
Demographics Similar to Palestinians and Immigrants from Chile by Average Family Size
In terms of average family size, the demographic groups most similar to Palestinians are Argentinean (3.23, a difference of 0.010%), Spaniard (3.23, a difference of 0.010%), Immigrants from Korea (3.23, a difference of 0.010%), Israeli (3.23, a difference of 0.040%), and Immigrants from South Central Asia (3.23, a difference of 0.060%). Similarly, the demographic groups most similar to Immigrants from Chile are Immigrants from Iraq (3.24, a difference of 0.010%), Immigrants from Uganda (3.23, a difference of 0.060%), Uruguayan (3.23, a difference of 0.080%), Egyptian (3.23, a difference of 0.090%), and Ugandan (3.23, a difference of 0.090%).
| Demographics | Rating | Rank | Average Family Size |
| Immigrants | Iraq | 63.7 /100 | #160 | Good 3.24 |
| Immigrants | Chile | 63.2 /100 | #161 | Good 3.24 |
| Immigrants | Uganda | 60.1 /100 | #162 | Good 3.23 |
| Uruguayans | 58.8 /100 | #163 | Average 3.23 |
| Egyptians | 58.6 /100 | #164 | Average 3.23 |
| Ugandans | 58.4 /100 | #165 | Average 3.23 |
| Immigrants | Senegal | 57.5 /100 | #166 | Average 3.23 |
| Dutch West Indians | 56.9 /100 | #167 | Average 3.23 |
| Taiwanese | 54.2 /100 | #168 | Average 3.23 |
| Aleuts | 54.1 /100 | #169 | Average 3.23 |
| Arabs | 53.8 /100 | #170 | Average 3.23 |
| Chileans | 53.2 /100 | #171 | Average 3.23 |
| Immigrants | Congo | 52.7 /100 | #172 | Average 3.23 |
| Immigrants | Uruguay | 52.0 /100 | #173 | Average 3.23 |
| Immigrants | South Central Asia | 50.0 /100 | #174 | Average 3.23 |
| Immigrants | China | 49.9 /100 | #175 | Average 3.23 |
| Israelis | 48.7 /100 | #176 | Average 3.23 |
| Argentineans | 47.4 /100 | #177 | Average 3.23 |
| Spaniards | 47.2 /100 | #178 | Average 3.23 |
| Immigrants | Korea | 46.9 /100 | #179 | Average 3.23 |
| Palestinians | 46.6 /100 | #180 | Average 3.23 |