Somali vs Immigrants from Lithuania Divorced or Separated
COMPARE
Somali
Immigrants from Lithuania
Divorced or Separated
Divorced or Separated Comparison
Somalis
Immigrants from Lithuania
12.6%
DIVORCED OR SEPARATED
0.9/ 100
METRIC RATING
253rd/ 347
METRIC RANK
11.3%
DIVORCED OR SEPARATED
99.9/ 100
METRIC RATING
53rd/ 347
METRIC RANK
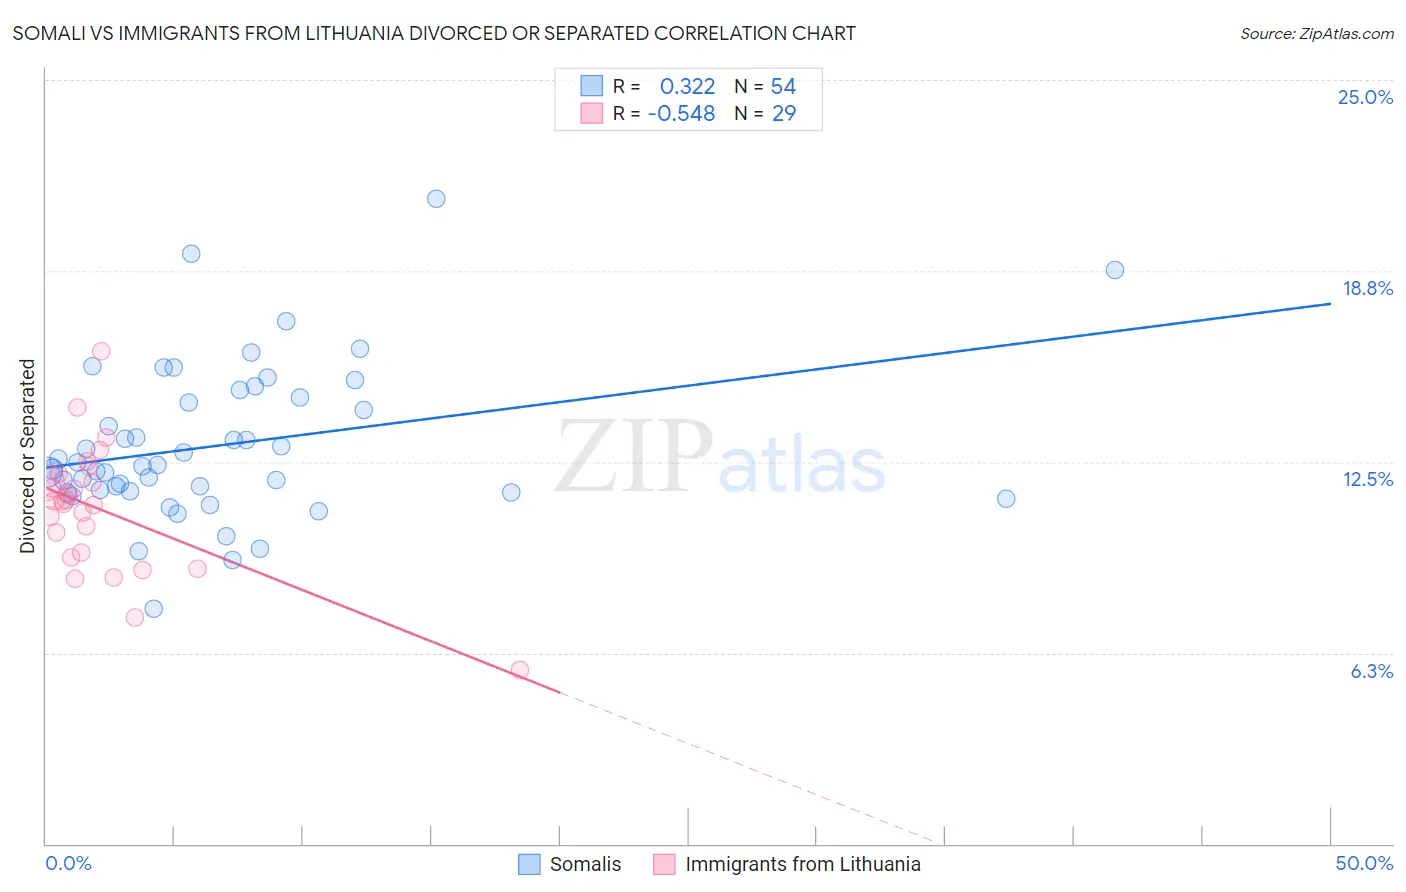
Somali vs Immigrants from Lithuania Divorced or Separated Correlation Chart
The statistical analysis conducted on geographies consisting of 99,313,071 people shows a mild positive correlation between the proportion of Somalis and percentage of population currently divorced or separated in the United States with a correlation coefficient (R) of 0.322 and weighted average of 12.6%. Similarly, the statistical analysis conducted on geographies consisting of 117,722,237 people shows a substantial negative correlation between the proportion of Immigrants from Lithuania and percentage of population currently divorced or separated in the United States with a correlation coefficient (R) of -0.548 and weighted average of 11.3%, a difference of 11.2%.
Divorced or Separated Correlation Summary
| Measurement | Somali | Immigrants from Lithuania |
| Minimum | 7.7% | 5.7% |
| Maximum | 21.1% | 16.1% |
| Range | 13.4% | 10.4% |
| Mean | 13.0% | 10.9% |
| Median | 12.4% | 11.2% |
| Interquartile 25% (IQ1) | 11.5% | 9.5% |
| Interquartile 75% (IQ3) | 14.6% | 12.0% |
| Interquartile Range (IQR) | 3.1% | 2.5% |
| Standard Deviation (Sample) | 2.5% | 2.1% |
| Standard Deviation (Population) | 2.5% | 2.0% |
Similar Demographics by Divorced or Separated
Demographics Similar to Somalis by Divorced or Separated
In terms of divorced or separated, the demographic groups most similar to Somalis are Liberian (12.6%, a difference of 0.0%), Senegalese (12.6%, a difference of 0.060%), Welsh (12.6%, a difference of 0.16%), Immigrants from Colombia (12.6%, a difference of 0.31%), and Irish (12.5%, a difference of 0.33%).
| Demographics | Rating | Rank | Divorced or Separated |
| Immigrants | West Indies | 1.9 /100 | #246 | Tragic 12.5% |
| Germans | 1.8 /100 | #247 | Tragic 12.5% |
| Nepalese | 1.8 /100 | #248 | Tragic 12.5% |
| Finns | 1.8 /100 | #249 | Tragic 12.5% |
| Irish | 1.3 /100 | #250 | Tragic 12.5% |
| Aleuts | 1.3 /100 | #251 | Tragic 12.5% |
| Liberians | 0.9 /100 | #252 | Tragic 12.6% |
| Somalis | 0.9 /100 | #253 | Tragic 12.6% |
| Senegalese | 0.8 /100 | #254 | Tragic 12.6% |
| Welsh | 0.7 /100 | #255 | Tragic 12.6% |
| Immigrants | Colombia | 0.6 /100 | #256 | Tragic 12.6% |
| Immigrants | Somalia | 0.6 /100 | #257 | Tragic 12.6% |
| Indonesians | 0.6 /100 | #258 | Tragic 12.6% |
| Yuman | 0.6 /100 | #259 | Tragic 12.6% |
| Immigrants | Uruguay | 0.6 /100 | #260 | Tragic 12.6% |
Demographics Similar to Immigrants from Lithuania by Divorced or Separated
In terms of divorced or separated, the demographic groups most similar to Immigrants from Lithuania are Eastern European (11.3%, a difference of 0.11%), Immigrants from Yemen (11.3%, a difference of 0.12%), Immigrants from Philippines (11.3%, a difference of 0.19%), Immigrants from Vietnam (11.3%, a difference of 0.19%), and Immigrants from Australia (11.3%, a difference of 0.23%).
| Demographics | Rating | Rank | Divorced or Separated |
| Laotians | 100.0 /100 | #46 | Exceptional 11.2% |
| Immigrants | Poland | 100.0 /100 | #47 | Exceptional 11.2% |
| Immigrants | Turkey | 100.0 /100 | #48 | Exceptional 11.2% |
| Immigrants | Saudi Arabia | 100.0 /100 | #49 | Exceptional 11.2% |
| Bolivians | 100.0 /100 | #50 | Exceptional 11.2% |
| Immigrants | Bolivia | 100.0 /100 | #51 | Exceptional 11.3% |
| Immigrants | Australia | 99.9 /100 | #52 | Exceptional 11.3% |
| Immigrants | Lithuania | 99.9 /100 | #53 | Exceptional 11.3% |
| Eastern Europeans | 99.9 /100 | #54 | Exceptional 11.3% |
| Immigrants | Yemen | 99.9 /100 | #55 | Exceptional 11.3% |
| Immigrants | Philippines | 99.9 /100 | #56 | Exceptional 11.3% |
| Immigrants | Vietnam | 99.9 /100 | #57 | Exceptional 11.3% |
| Sri Lankans | 99.9 /100 | #58 | Exceptional 11.3% |
| Israelis | 99.9 /100 | #59 | Exceptional 11.3% |
| Immigrants | Russia | 99.9 /100 | #60 | Exceptional 11.3% |