Spanish American Indian vs Immigrants from Lithuania Divorced or Separated
COMPARE
Spanish American Indian
Immigrants from Lithuania
Divorced or Separated
Divorced or Separated Comparison
Spanish American Indians
Immigrants from Lithuania
11.6%
DIVORCED OR SEPARATED
99.0/ 100
METRIC RATING
91st/ 347
METRIC RANK
11.3%
DIVORCED OR SEPARATED
99.9/ 100
METRIC RATING
53rd/ 347
METRIC RANK
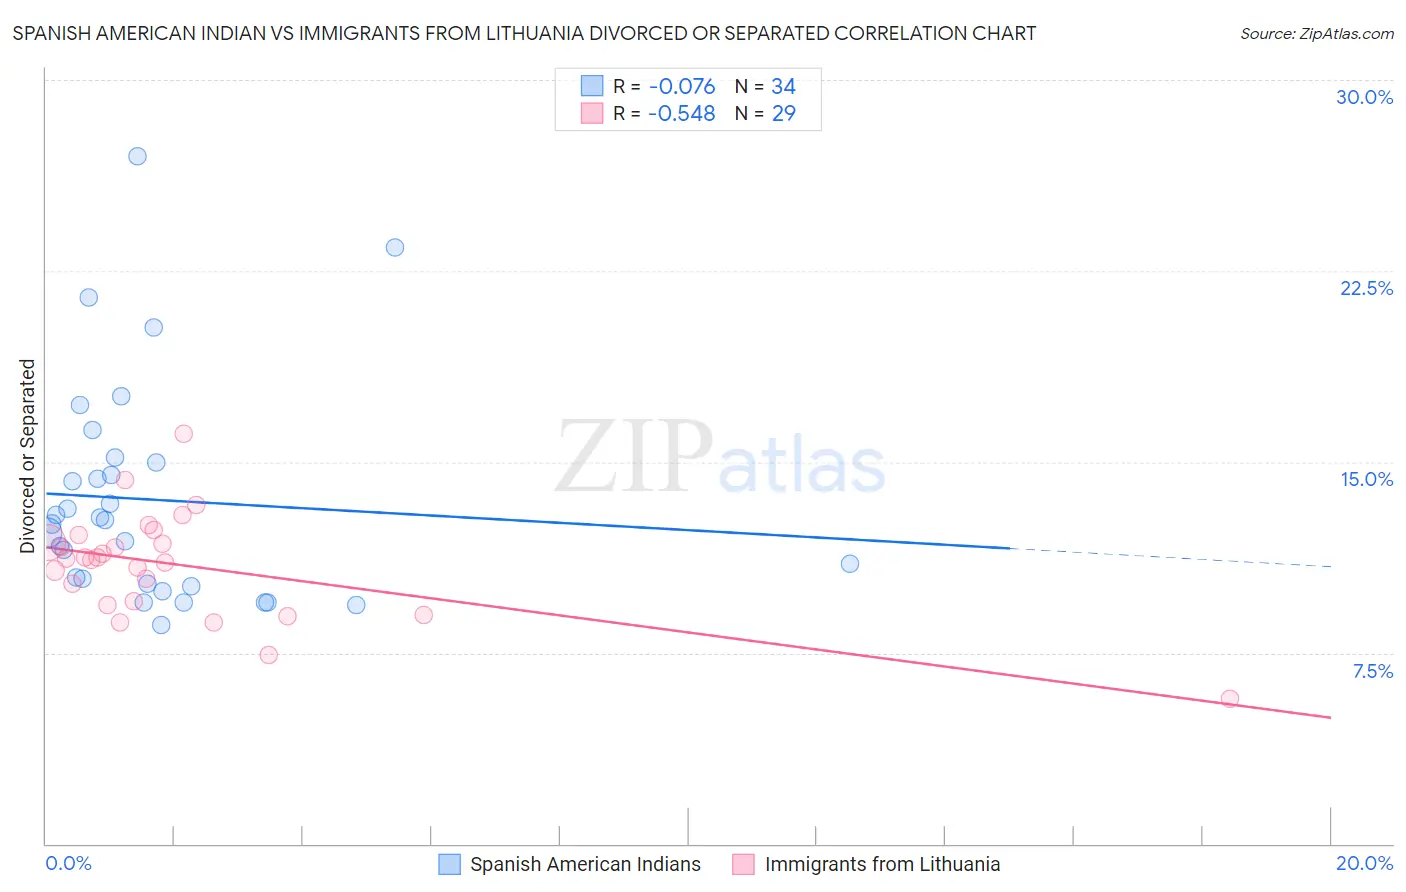
Spanish American Indian vs Immigrants from Lithuania Divorced or Separated Correlation Chart
The statistical analysis conducted on geographies consisting of 73,145,304 people shows a slight negative correlation between the proportion of Spanish American Indians and percentage of population currently divorced or separated in the United States with a correlation coefficient (R) of -0.076 and weighted average of 11.6%. Similarly, the statistical analysis conducted on geographies consisting of 117,722,237 people shows a substantial negative correlation between the proportion of Immigrants from Lithuania and percentage of population currently divorced or separated in the United States with a correlation coefficient (R) of -0.548 and weighted average of 11.3%, a difference of 2.6%.
Divorced or Separated Correlation Summary
| Measurement | Spanish American Indian | Immigrants from Lithuania |
| Minimum | 8.6% | 5.7% |
| Maximum | 27.0% | 16.1% |
| Range | 18.4% | 10.4% |
| Mean | 13.5% | 10.9% |
| Median | 12.6% | 11.2% |
| Interquartile 25% (IQ1) | 10.2% | 9.5% |
| Interquartile 75% (IQ3) | 15.0% | 12.0% |
| Interquartile Range (IQR) | 4.8% | 2.5% |
| Standard Deviation (Sample) | 4.3% | 2.1% |
| Standard Deviation (Population) | 4.3% | 2.0% |
Similar Demographics by Divorced or Separated
Demographics Similar to Spanish American Indians by Divorced or Separated
In terms of divorced or separated, the demographic groups most similar to Spanish American Indians are Zimbabwean (11.6%, a difference of 0.040%), Immigrants from Denmark (11.6%, a difference of 0.060%), Arab (11.6%, a difference of 0.060%), Immigrants from Fiji (11.6%, a difference of 0.070%), and Immigrants from Southern Europe (11.6%, a difference of 0.14%).
| Demographics | Rating | Rank | Divorced or Separated |
| Bulgarians | 99.3 /100 | #84 | Exceptional 11.5% |
| Immigrants | Albania | 99.3 /100 | #85 | Exceptional 11.5% |
| Immigrants | Latvia | 99.2 /100 | #86 | Exceptional 11.6% |
| Immigrants | Nepal | 99.2 /100 | #87 | Exceptional 11.6% |
| Immigrants | Europe | 99.2 /100 | #88 | Exceptional 11.6% |
| Immigrants | Southern Europe | 99.1 /100 | #89 | Exceptional 11.6% |
| Zimbabweans | 99.0 /100 | #90 | Exceptional 11.6% |
| Spanish American Indians | 99.0 /100 | #91 | Exceptional 11.6% |
| Immigrants | Denmark | 98.9 /100 | #92 | Exceptional 11.6% |
| Arabs | 98.9 /100 | #93 | Exceptional 11.6% |
| Immigrants | Fiji | 98.9 /100 | #94 | Exceptional 11.6% |
| Immigrants | Serbia | 98.8 /100 | #95 | Exceptional 11.6% |
| Immigrants | Ukraine | 98.7 /100 | #96 | Exceptional 11.6% |
| Latvians | 98.7 /100 | #97 | Exceptional 11.6% |
| Immigrants | Jordan | 98.6 /100 | #98 | Exceptional 11.6% |
Demographics Similar to Immigrants from Lithuania by Divorced or Separated
In terms of divorced or separated, the demographic groups most similar to Immigrants from Lithuania are Eastern European (11.3%, a difference of 0.11%), Immigrants from Yemen (11.3%, a difference of 0.12%), Immigrants from Philippines (11.3%, a difference of 0.19%), Immigrants from Vietnam (11.3%, a difference of 0.19%), and Immigrants from Australia (11.3%, a difference of 0.23%).
| Demographics | Rating | Rank | Divorced or Separated |
| Laotians | 100.0 /100 | #46 | Exceptional 11.2% |
| Immigrants | Poland | 100.0 /100 | #47 | Exceptional 11.2% |
| Immigrants | Turkey | 100.0 /100 | #48 | Exceptional 11.2% |
| Immigrants | Saudi Arabia | 100.0 /100 | #49 | Exceptional 11.2% |
| Bolivians | 100.0 /100 | #50 | Exceptional 11.2% |
| Immigrants | Bolivia | 100.0 /100 | #51 | Exceptional 11.3% |
| Immigrants | Australia | 99.9 /100 | #52 | Exceptional 11.3% |
| Immigrants | Lithuania | 99.9 /100 | #53 | Exceptional 11.3% |
| Eastern Europeans | 99.9 /100 | #54 | Exceptional 11.3% |
| Immigrants | Yemen | 99.9 /100 | #55 | Exceptional 11.3% |
| Immigrants | Philippines | 99.9 /100 | #56 | Exceptional 11.3% |
| Immigrants | Vietnam | 99.9 /100 | #57 | Exceptional 11.3% |
| Sri Lankans | 99.9 /100 | #58 | Exceptional 11.3% |
| Israelis | 99.9 /100 | #59 | Exceptional 11.3% |
| Immigrants | Russia | 99.9 /100 | #60 | Exceptional 11.3% |