Osage vs Immigrants from Bulgaria Divorced or Separated
COMPARE
Osage
Immigrants from Bulgaria
Divorced or Separated
Divorced or Separated Comparison
Osage
Immigrants from Bulgaria
13.4%
DIVORCED OR SEPARATED
0.0/ 100
METRIC RATING
324th/ 347
METRIC RANK
11.5%
DIVORCED OR SEPARATED
99.3/ 100
METRIC RATING
83rd/ 347
METRIC RANK
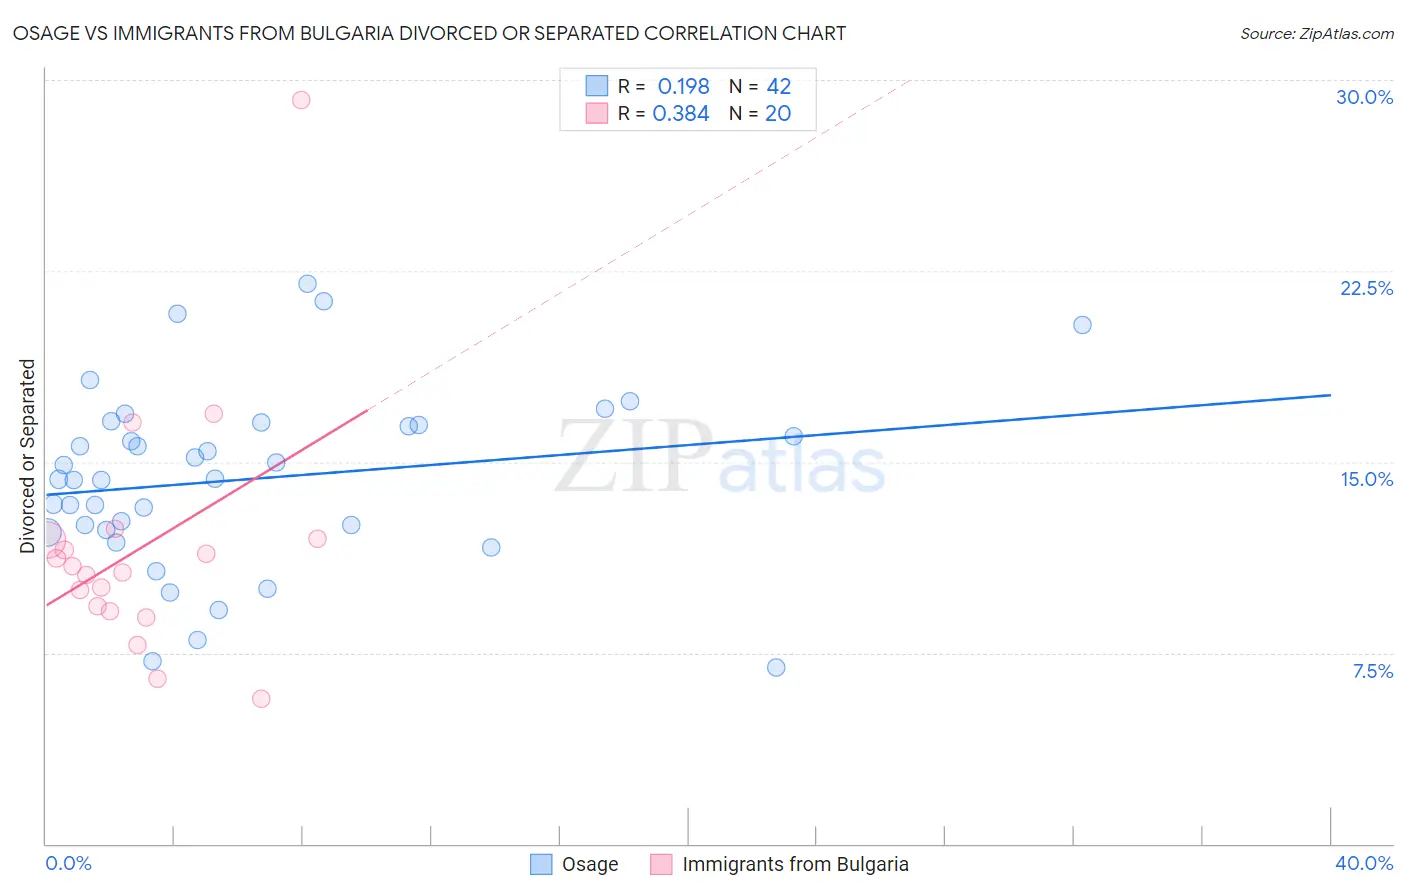
Osage vs Immigrants from Bulgaria Divorced or Separated Correlation Chart
The statistical analysis conducted on geographies consisting of 91,805,923 people shows a poor positive correlation between the proportion of Osage and percentage of population currently divorced or separated in the United States with a correlation coefficient (R) of 0.198 and weighted average of 13.4%. Similarly, the statistical analysis conducted on geographies consisting of 172,542,823 people shows a mild positive correlation between the proportion of Immigrants from Bulgaria and percentage of population currently divorced or separated in the United States with a correlation coefficient (R) of 0.384 and weighted average of 11.5%, a difference of 16.6%.
Divorced or Separated Correlation Summary
| Measurement | Osage | Immigrants from Bulgaria |
| Minimum | 6.9% | 5.7% |
| Maximum | 22.0% | 29.2% |
| Range | 15.1% | 23.5% |
| Mean | 14.3% | 11.6% |
| Median | 14.3% | 10.8% |
| Interquartile 25% (IQ1) | 12.3% | 9.2% |
| Interquartile 75% (IQ3) | 16.5% | 12.0% |
| Interquartile Range (IQR) | 4.1% | 2.7% |
| Standard Deviation (Sample) | 3.5% | 4.9% |
| Standard Deviation (Population) | 3.5% | 4.8% |
Similar Demographics by Divorced or Separated
Demographics Similar to Osage by Divorced or Separated
In terms of divorced or separated, the demographic groups most similar to Osage are Potawatomi (13.5%, a difference of 0.060%), U.S. Virgin Islander (13.4%, a difference of 0.070%), Immigrants from Congo (13.5%, a difference of 0.070%), Immigrants from Haiti (13.4%, a difference of 0.29%), and Cheyenne (13.4%, a difference of 0.53%).
| Demographics | Rating | Rank | Divorced or Separated |
| Haitians | 0.0 /100 | #317 | Tragic 13.3% |
| Cree | 0.0 /100 | #318 | Tragic 13.4% |
| Puget Sound Salish | 0.0 /100 | #319 | Tragic 13.4% |
| Cajuns | 0.0 /100 | #320 | Tragic 13.4% |
| Cheyenne | 0.0 /100 | #321 | Tragic 13.4% |
| Immigrants | Haiti | 0.0 /100 | #322 | Tragic 13.4% |
| U.S. Virgin Islanders | 0.0 /100 | #323 | Tragic 13.4% |
| Osage | 0.0 /100 | #324 | Tragic 13.4% |
| Potawatomi | 0.0 /100 | #325 | Tragic 13.5% |
| Immigrants | Congo | 0.0 /100 | #326 | Tragic 13.5% |
| Comanche | 0.0 /100 | #327 | Tragic 13.5% |
| Immigrants | Caribbean | 0.0 /100 | #328 | Tragic 13.6% |
| Houma | 0.0 /100 | #329 | Tragic 13.6% |
| Paiute | 0.0 /100 | #330 | Tragic 13.6% |
| Blacks/African Americans | 0.0 /100 | #331 | Tragic 13.6% |
Demographics Similar to Immigrants from Bulgaria by Divorced or Separated
In terms of divorced or separated, the demographic groups most similar to Immigrants from Bulgaria are Bulgarian (11.5%, a difference of 0.020%), Immigrants from Romania (11.5%, a difference of 0.030%), Immigrants from Albania (11.5%, a difference of 0.080%), Russian (11.5%, a difference of 0.11%), and Immigrants from Switzerland (11.5%, a difference of 0.12%).
| Demographics | Rating | Rank | Divorced or Separated |
| Albanians | 99.6 /100 | #76 | Exceptional 11.5% |
| Immigrants | Italy | 99.5 /100 | #77 | Exceptional 11.5% |
| Afghans | 99.4 /100 | #78 | Exceptional 11.5% |
| Guyanese | 99.4 /100 | #79 | Exceptional 11.5% |
| Immigrants | Switzerland | 99.4 /100 | #80 | Exceptional 11.5% |
| Russians | 99.4 /100 | #81 | Exceptional 11.5% |
| Immigrants | Romania | 99.3 /100 | #82 | Exceptional 11.5% |
| Immigrants | Bulgaria | 99.3 /100 | #83 | Exceptional 11.5% |
| Bulgarians | 99.3 /100 | #84 | Exceptional 11.5% |
| Immigrants | Albania | 99.3 /100 | #85 | Exceptional 11.5% |
| Immigrants | Latvia | 99.2 /100 | #86 | Exceptional 11.6% |
| Immigrants | Nepal | 99.2 /100 | #87 | Exceptional 11.6% |
| Immigrants | Europe | 99.2 /100 | #88 | Exceptional 11.6% |
| Immigrants | Southern Europe | 99.1 /100 | #89 | Exceptional 11.6% |
| Zimbabweans | 99.0 /100 | #90 | Exceptional 11.6% |