New Zealander vs Immigrants from Germany Divorced or Separated
COMPARE
New Zealander
Immigrants from Germany
Divorced or Separated
Divorced or Separated Comparison
New Zealanders
Immigrants from Germany
11.9%
DIVORCED OR SEPARATED
87.5/ 100
METRIC RATING
133rd/ 347
METRIC RANK
12.4%
DIVORCED OR SEPARATED
4.0/ 100
METRIC RATING
239th/ 347
METRIC RANK
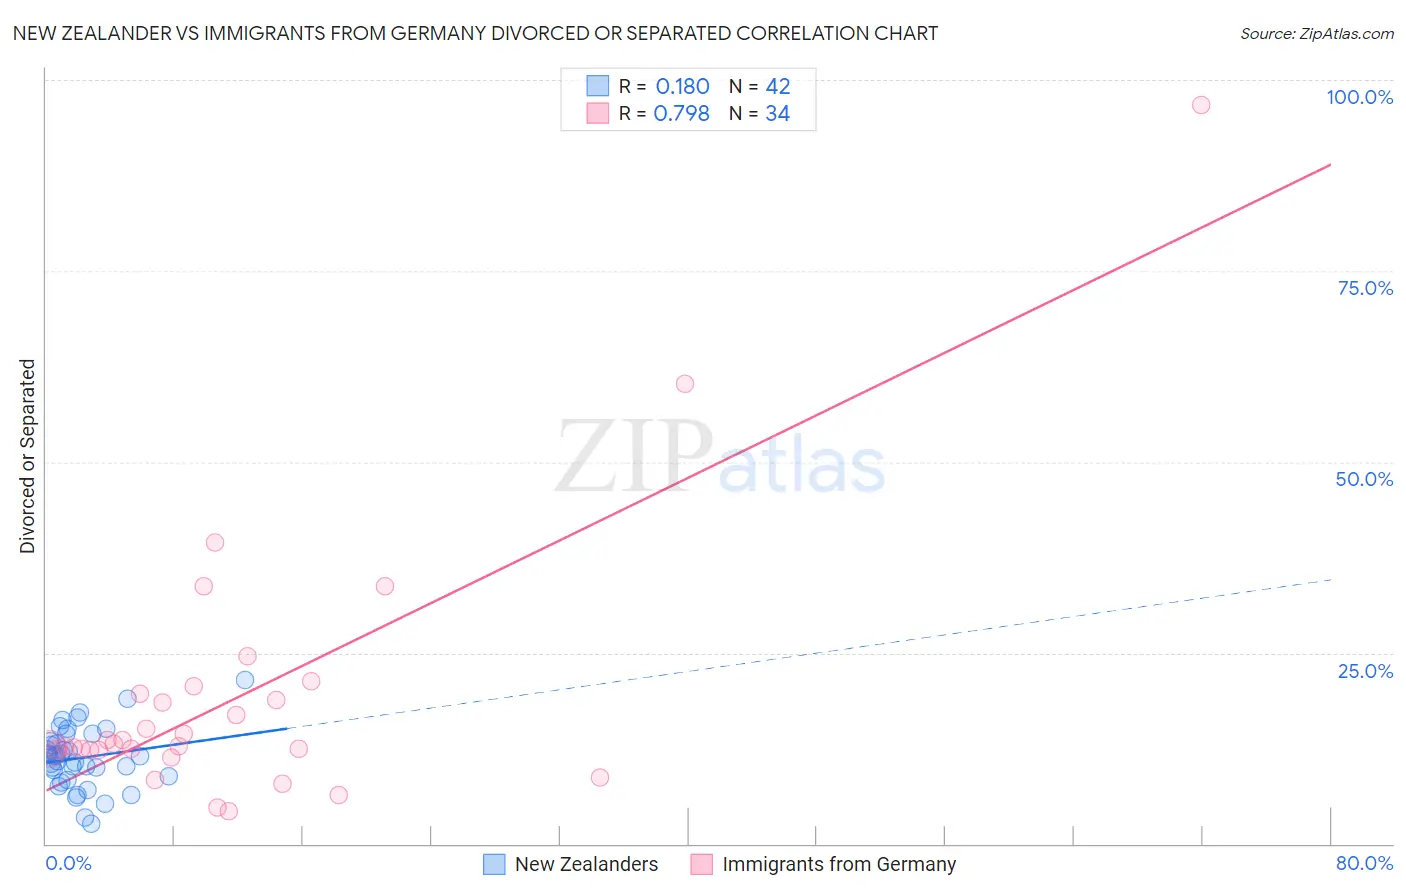
New Zealander vs Immigrants from Germany Divorced or Separated Correlation Chart
The statistical analysis conducted on geographies consisting of 106,899,589 people shows a poor positive correlation between the proportion of New Zealanders and percentage of population currently divorced or separated in the United States with a correlation coefficient (R) of 0.180 and weighted average of 11.9%. Similarly, the statistical analysis conducted on geographies consisting of 463,791,501 people shows a strong positive correlation between the proportion of Immigrants from Germany and percentage of population currently divorced or separated in the United States with a correlation coefficient (R) of 0.798 and weighted average of 12.4%, a difference of 4.5%.
Divorced or Separated Correlation Summary
| Measurement | New Zealander | Immigrants from Germany |
| Minimum | 2.6% | 4.2% |
| Maximum | 21.4% | 96.8% |
| Range | 18.8% | 92.6% |
| Mean | 11.2% | 19.1% |
| Median | 11.4% | 13.0% |
| Interquartile 25% (IQ1) | 8.9% | 12.3% |
| Interquartile 75% (IQ3) | 13.4% | 19.6% |
| Interquartile Range (IQR) | 4.5% | 7.3% |
| Standard Deviation (Sample) | 4.0% | 17.6% |
| Standard Deviation (Population) | 3.9% | 17.3% |
Similar Demographics by Divorced or Separated
Demographics Similar to New Zealanders by Divorced or Separated
In terms of divorced or separated, the demographic groups most similar to New Zealanders are Immigrants from Afghanistan (11.8%, a difference of 0.030%), Immigrants from Austria (11.8%, a difference of 0.060%), Immigrants from Cambodia (11.8%, a difference of 0.060%), Immigrants from St. Vincent and the Grenadines (11.8%, a difference of 0.070%), and Immigrants from Ecuador (11.8%, a difference of 0.11%).
| Demographics | Rating | Rank | Divorced or Separated |
| South American Indians | 92.1 /100 | #126 | Exceptional 11.8% |
| South Africans | 88.9 /100 | #127 | Excellent 11.8% |
| Immigrants | Ecuador | 88.9 /100 | #128 | Excellent 11.8% |
| Immigrants | St. Vincent and the Grenadines | 88.4 /100 | #129 | Excellent 11.8% |
| Immigrants | Austria | 88.2 /100 | #130 | Excellent 11.8% |
| Immigrants | Cambodia | 88.2 /100 | #131 | Excellent 11.8% |
| Immigrants | Afghanistan | 87.9 /100 | #132 | Excellent 11.8% |
| New Zealanders | 87.5 /100 | #133 | Excellent 11.9% |
| Argentineans | 85.1 /100 | #134 | Excellent 11.9% |
| Danes | 84.8 /100 | #135 | Excellent 11.9% |
| Carpatho Rusyns | 84.8 /100 | #136 | Excellent 11.9% |
| Alsatians | 84.0 /100 | #137 | Excellent 11.9% |
| Immigrants | Netherlands | 83.9 /100 | #138 | Excellent 11.9% |
| Australians | 83.6 /100 | #139 | Excellent 11.9% |
| Lebanese | 83.4 /100 | #140 | Excellent 11.9% |
Demographics Similar to Immigrants from Germany by Divorced or Separated
In terms of divorced or separated, the demographic groups most similar to Immigrants from Germany are Sudanese (12.4%, a difference of 0.010%), Colombian (12.4%, a difference of 0.040%), Immigrants from Laos (12.4%, a difference of 0.040%), British West Indian (12.4%, a difference of 0.050%), and Immigrants from Bosnia and Herzegovina (12.4%, a difference of 0.070%).
| Demographics | Rating | Rank | Divorced or Separated |
| Canadians | 5.3 /100 | #232 | Tragic 12.4% |
| Malaysians | 4.8 /100 | #233 | Tragic 12.4% |
| West Indians | 4.4 /100 | #234 | Tragic 12.4% |
| Immigrants | Bosnia and Herzegovina | 4.3 /100 | #235 | Tragic 12.4% |
| Colombians | 4.2 /100 | #236 | Tragic 12.4% |
| Immigrants | Laos | 4.2 /100 | #237 | Tragic 12.4% |
| Sudanese | 4.0 /100 | #238 | Tragic 12.4% |
| Immigrants | Germany | 4.0 /100 | #239 | Tragic 12.4% |
| British West Indians | 3.7 /100 | #240 | Tragic 12.4% |
| Uruguayans | 3.4 /100 | #241 | Tragic 12.4% |
| Dutch | 3.1 /100 | #242 | Tragic 12.4% |
| Immigrants | Latin America | 2.8 /100 | #243 | Tragic 12.4% |
| Alaska Natives | 2.5 /100 | #244 | Tragic 12.4% |
| Hispanics or Latinos | 2.0 /100 | #245 | Tragic 12.5% |
| Immigrants | West Indies | 1.9 /100 | #246 | Tragic 12.5% |