Nonimmigrants vs Immigrants from Germany Divorced or Separated
COMPARE
Nonimmigrants
Immigrants from Germany
Divorced or Separated
Divorced or Separated Comparison
Nonimmigrants
Immigrants from Germany
12.8%
DIVORCED OR SEPARATED
0.1/ 100
METRIC RATING
284th/ 347
METRIC RANK
12.4%
DIVORCED OR SEPARATED
4.0/ 100
METRIC RATING
239th/ 347
METRIC RANK
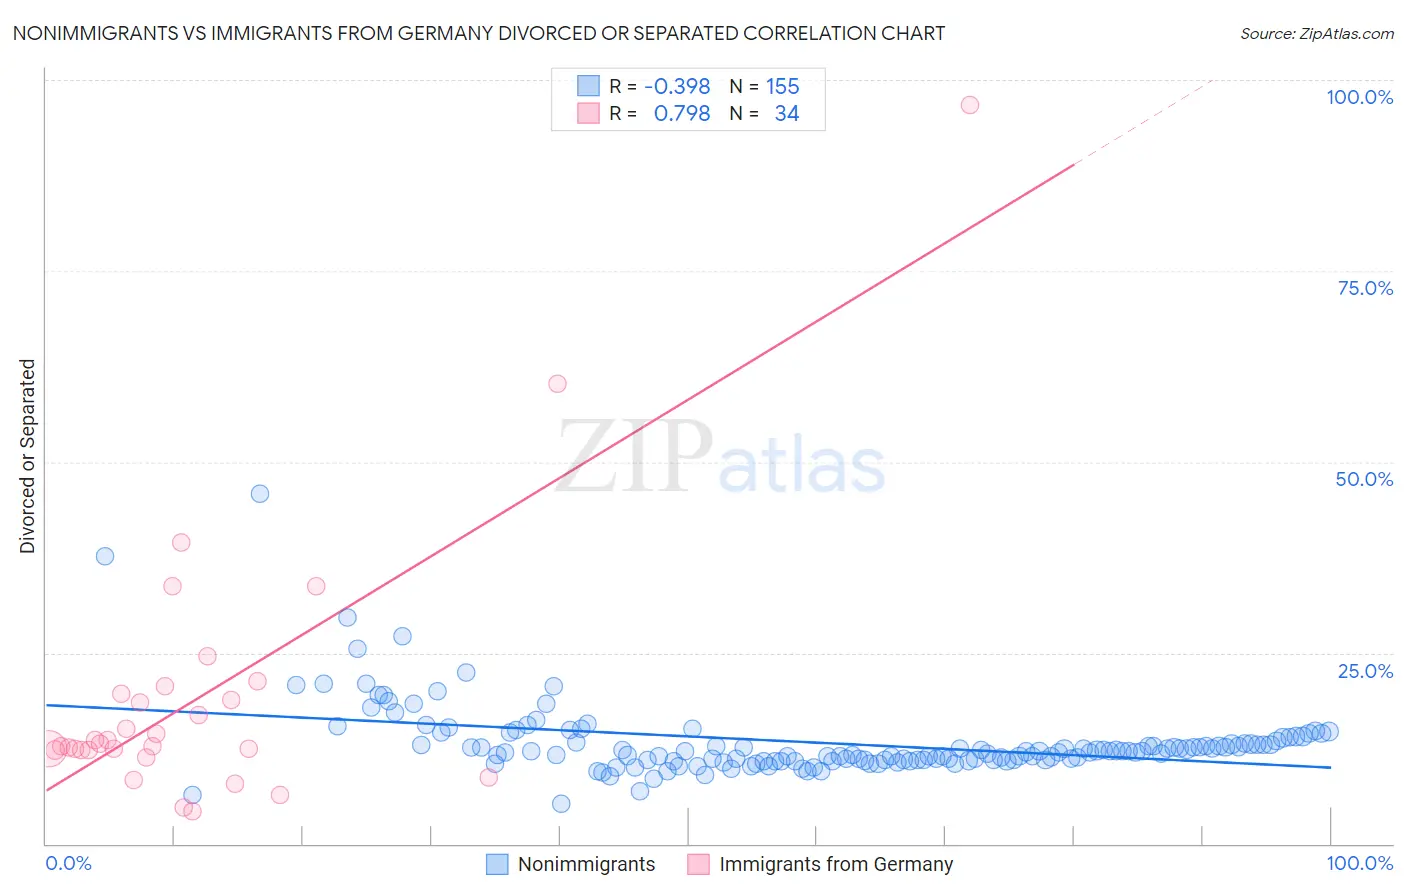
Nonimmigrants vs Immigrants from Germany Divorced or Separated Correlation Chart
The statistical analysis conducted on geographies consisting of 584,532,053 people shows a mild negative correlation between the proportion of Nonimmigrants and percentage of population currently divorced or separated in the United States with a correlation coefficient (R) of -0.398 and weighted average of 12.8%. Similarly, the statistical analysis conducted on geographies consisting of 463,791,501 people shows a strong positive correlation between the proportion of Immigrants from Germany and percentage of population currently divorced or separated in the United States with a correlation coefficient (R) of 0.798 and weighted average of 12.4%, a difference of 2.9%.
Divorced or Separated Correlation Summary
| Measurement | Nonimmigrants | Immigrants from Germany |
| Minimum | 5.3% | 4.2% |
| Maximum | 45.8% | 96.8% |
| Range | 40.5% | 92.6% |
| Mean | 13.2% | 19.1% |
| Median | 12.1% | 13.0% |
| Interquartile 25% (IQ1) | 10.9% | 12.3% |
| Interquartile 75% (IQ3) | 13.5% | 19.6% |
| Interquartile Range (IQR) | 2.6% | 7.3% |
| Standard Deviation (Sample) | 4.8% | 17.6% |
| Standard Deviation (Population) | 4.8% | 17.3% |
Similar Demographics by Divorced or Separated
Demographics Similar to Nonimmigrants by Divorced or Separated
In terms of divorced or separated, the demographic groups most similar to Nonimmigrants are French (12.8%, a difference of 0.040%), Delaware (12.7%, a difference of 0.090%), Subsaharan African (12.7%, a difference of 0.10%), Pueblo (12.7%, a difference of 0.22%), and Immigrants from Zaire (12.7%, a difference of 0.26%).
| Demographics | Rating | Rank | Divorced or Separated |
| Dominicans | 0.2 /100 | #277 | Tragic 12.7% |
| Lumbee | 0.2 /100 | #278 | Tragic 12.7% |
| Immigrants | Dominican Republic | 0.2 /100 | #279 | Tragic 12.7% |
| Immigrants | Zaire | 0.2 /100 | #280 | Tragic 12.7% |
| Pueblo | 0.2 /100 | #281 | Tragic 12.7% |
| Sub-Saharan Africans | 0.1 /100 | #282 | Tragic 12.7% |
| Delaware | 0.1 /100 | #283 | Tragic 12.7% |
| Immigrants | Nonimmigrants | 0.1 /100 | #284 | Tragic 12.8% |
| French | 0.1 /100 | #285 | Tragic 12.8% |
| Spanish | 0.1 /100 | #286 | Tragic 12.8% |
| Hondurans | 0.1 /100 | #287 | Tragic 12.8% |
| French Canadians | 0.1 /100 | #288 | Tragic 12.8% |
| Iroquois | 0.0 /100 | #289 | Tragic 12.9% |
| Pima | 0.0 /100 | #290 | Tragic 12.9% |
| Immigrants | Honduras | 0.0 /100 | #291 | Tragic 12.9% |
Demographics Similar to Immigrants from Germany by Divorced or Separated
In terms of divorced or separated, the demographic groups most similar to Immigrants from Germany are Sudanese (12.4%, a difference of 0.010%), Colombian (12.4%, a difference of 0.040%), Immigrants from Laos (12.4%, a difference of 0.040%), British West Indian (12.4%, a difference of 0.050%), and Immigrants from Bosnia and Herzegovina (12.4%, a difference of 0.070%).
| Demographics | Rating | Rank | Divorced or Separated |
| Canadians | 5.3 /100 | #232 | Tragic 12.4% |
| Malaysians | 4.8 /100 | #233 | Tragic 12.4% |
| West Indians | 4.4 /100 | #234 | Tragic 12.4% |
| Immigrants | Bosnia and Herzegovina | 4.3 /100 | #235 | Tragic 12.4% |
| Colombians | 4.2 /100 | #236 | Tragic 12.4% |
| Immigrants | Laos | 4.2 /100 | #237 | Tragic 12.4% |
| Sudanese | 4.0 /100 | #238 | Tragic 12.4% |
| Immigrants | Germany | 4.0 /100 | #239 | Tragic 12.4% |
| British West Indians | 3.7 /100 | #240 | Tragic 12.4% |
| Uruguayans | 3.4 /100 | #241 | Tragic 12.4% |
| Dutch | 3.1 /100 | #242 | Tragic 12.4% |
| Immigrants | Latin America | 2.8 /100 | #243 | Tragic 12.4% |
| Alaska Natives | 2.5 /100 | #244 | Tragic 12.4% |
| Hispanics or Latinos | 2.0 /100 | #245 | Tragic 12.5% |
| Immigrants | West Indies | 1.9 /100 | #246 | Tragic 12.5% |