Nonimmigrants vs Swiss Divorced or Separated
COMPARE
Nonimmigrants
Swiss
Divorced or Separated
Divorced or Separated Comparison
Nonimmigrants
Swiss
12.8%
DIVORCED OR SEPARATED
0.1/ 100
METRIC RATING
284th/ 347
METRIC RANK
12.0%
DIVORCED OR SEPARATED
63.6/ 100
METRIC RATING
164th/ 347
METRIC RANK
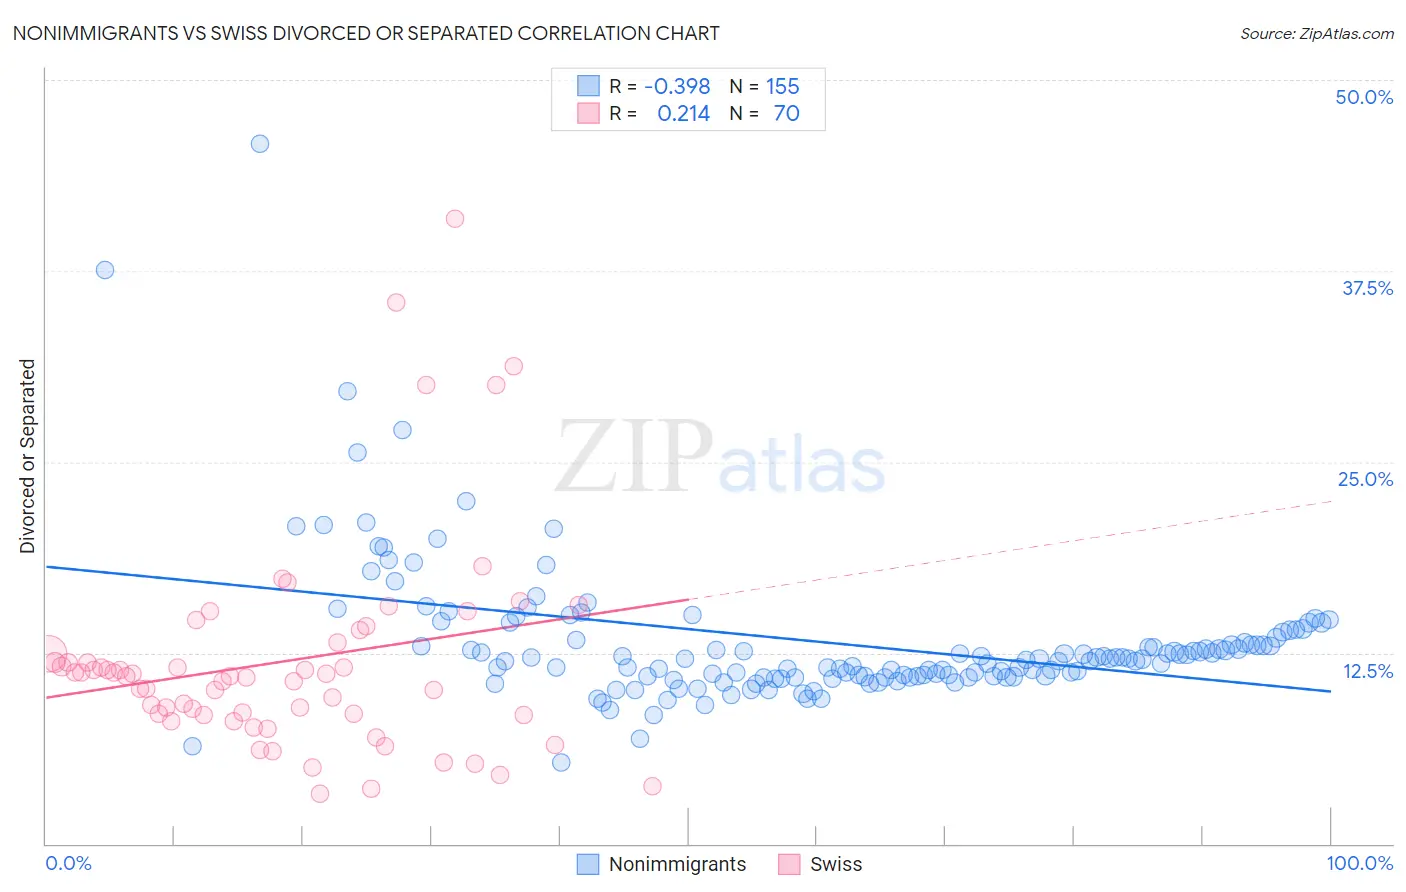
Nonimmigrants vs Swiss Divorced or Separated Correlation Chart
The statistical analysis conducted on geographies consisting of 584,532,053 people shows a mild negative correlation between the proportion of Nonimmigrants and percentage of population currently divorced or separated in the United States with a correlation coefficient (R) of -0.398 and weighted average of 12.8%. Similarly, the statistical analysis conducted on geographies consisting of 464,828,209 people shows a weak positive correlation between the proportion of Swiss and percentage of population currently divorced or separated in the United States with a correlation coefficient (R) of 0.214 and weighted average of 12.0%, a difference of 6.3%.
Divorced or Separated Correlation Summary
| Measurement | Nonimmigrants | Swiss |
| Minimum | 5.3% | 3.3% |
| Maximum | 45.8% | 40.9% |
| Range | 40.5% | 37.6% |
| Mean | 13.2% | 11.9% |
| Median | 12.1% | 11.0% |
| Interquartile 25% (IQ1) | 10.9% | 8.5% |
| Interquartile 75% (IQ3) | 13.5% | 12.4% |
| Interquartile Range (IQR) | 2.6% | 4.0% |
| Standard Deviation (Sample) | 4.8% | 7.0% |
| Standard Deviation (Population) | 4.8% | 6.9% |
Similar Demographics by Divorced or Separated
Demographics Similar to Nonimmigrants by Divorced or Separated
In terms of divorced or separated, the demographic groups most similar to Nonimmigrants are French (12.8%, a difference of 0.040%), Delaware (12.7%, a difference of 0.090%), Subsaharan African (12.7%, a difference of 0.10%), Pueblo (12.7%, a difference of 0.22%), and Immigrants from Zaire (12.7%, a difference of 0.26%).
| Demographics | Rating | Rank | Divorced or Separated |
| Dominicans | 0.2 /100 | #277 | Tragic 12.7% |
| Lumbee | 0.2 /100 | #278 | Tragic 12.7% |
| Immigrants | Dominican Republic | 0.2 /100 | #279 | Tragic 12.7% |
| Immigrants | Zaire | 0.2 /100 | #280 | Tragic 12.7% |
| Pueblo | 0.2 /100 | #281 | Tragic 12.7% |
| Sub-Saharan Africans | 0.1 /100 | #282 | Tragic 12.7% |
| Delaware | 0.1 /100 | #283 | Tragic 12.7% |
| Immigrants | Nonimmigrants | 0.1 /100 | #284 | Tragic 12.8% |
| French | 0.1 /100 | #285 | Tragic 12.8% |
| Spanish | 0.1 /100 | #286 | Tragic 12.8% |
| Hondurans | 0.1 /100 | #287 | Tragic 12.8% |
| French Canadians | 0.1 /100 | #288 | Tragic 12.8% |
| Iroquois | 0.0 /100 | #289 | Tragic 12.9% |
| Pima | 0.0 /100 | #290 | Tragic 12.9% |
| Immigrants | Honduras | 0.0 /100 | #291 | Tragic 12.9% |
Demographics Similar to Swiss by Divorced or Separated
In terms of divorced or separated, the demographic groups most similar to Swiss are Navajo (12.0%, a difference of 0.010%), Samoan (12.0%, a difference of 0.020%), Marshallese (12.0%, a difference of 0.040%), German Russian (12.0%, a difference of 0.070%), and Immigrants from Scotland (12.0%, a difference of 0.080%).
| Demographics | Rating | Rank | Divorced or Separated |
| Immigrants | Brazil | 68.8 /100 | #157 | Good 12.0% |
| Icelanders | 66.0 /100 | #158 | Good 12.0% |
| Immigrants | Barbados | 66.0 /100 | #159 | Good 12.0% |
| Immigrants | Scotland | 65.8 /100 | #160 | Good 12.0% |
| Marshallese | 64.6 /100 | #161 | Good 12.0% |
| Samoans | 64.3 /100 | #162 | Good 12.0% |
| Navajo | 63.9 /100 | #163 | Good 12.0% |
| Swiss | 63.6 /100 | #164 | Good 12.0% |
| German Russians | 61.8 /100 | #165 | Good 12.0% |
| Tohono O'odham | 60.4 /100 | #166 | Good 12.0% |
| Ethiopians | 58.5 /100 | #167 | Average 12.0% |
| Serbians | 57.1 /100 | #168 | Average 12.0% |
| Immigrants | Peru | 57.0 /100 | #169 | Average 12.0% |
| Mexican American Indians | 55.8 /100 | #170 | Average 12.0% |
| Costa Ricans | 53.3 /100 | #171 | Average 12.0% |