Seminole vs Swiss Divorced or Separated
COMPARE
Seminole
Swiss
Divorced or Separated
Divorced or Separated Comparison
Seminole
Swiss
14.3%
DIVORCED OR SEPARATED
0.0/ 100
METRIC RATING
342nd/ 347
METRIC RANK
12.0%
DIVORCED OR SEPARATED
63.6/ 100
METRIC RATING
164th/ 347
METRIC RANK
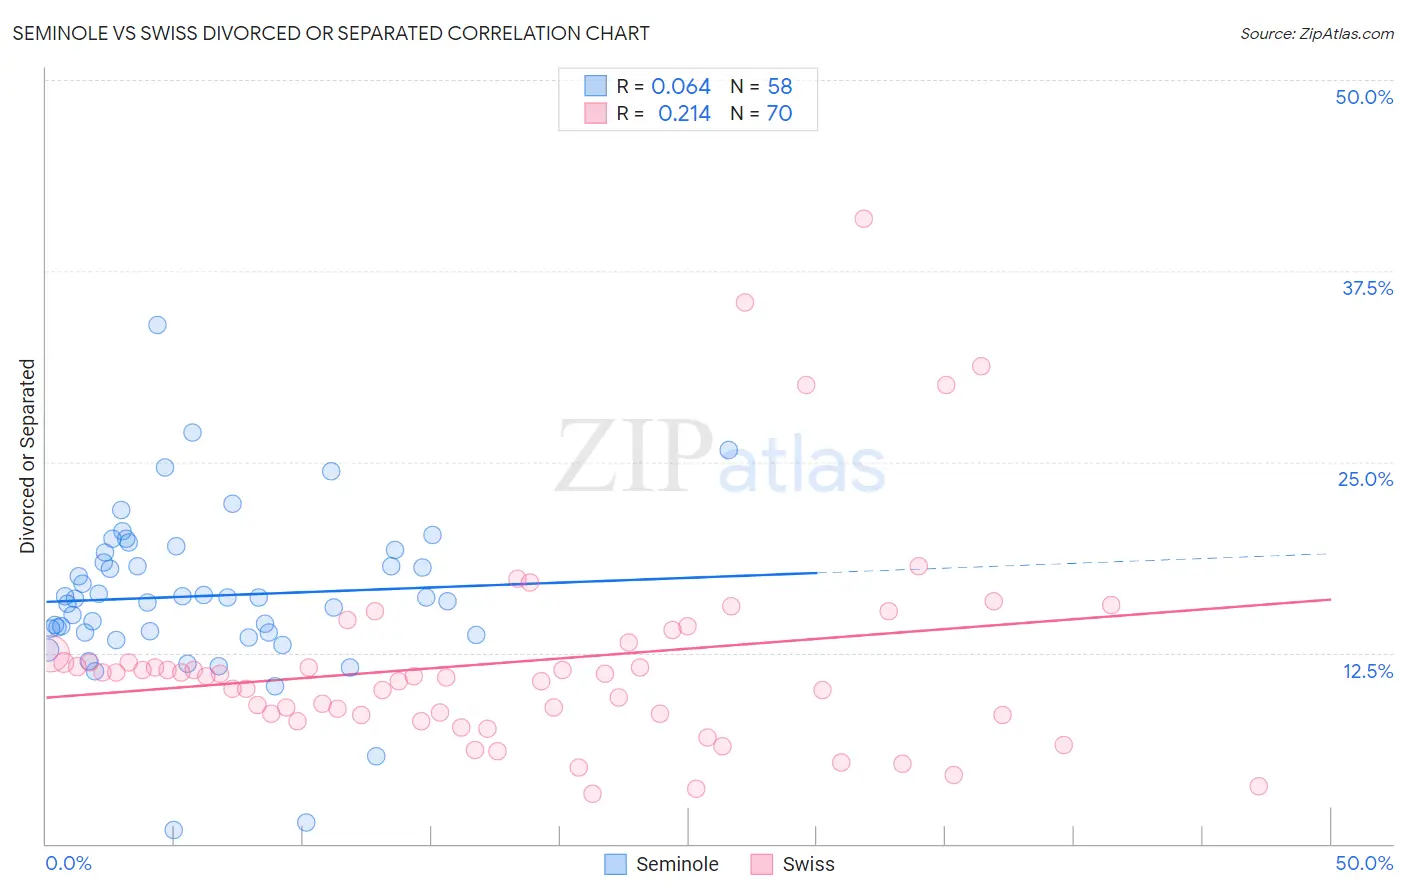
Seminole vs Swiss Divorced or Separated Correlation Chart
The statistical analysis conducted on geographies consisting of 118,302,792 people shows a slight positive correlation between the proportion of Seminole and percentage of population currently divorced or separated in the United States with a correlation coefficient (R) of 0.064 and weighted average of 14.3%. Similarly, the statistical analysis conducted on geographies consisting of 464,828,209 people shows a weak positive correlation between the proportion of Swiss and percentage of population currently divorced or separated in the United States with a correlation coefficient (R) of 0.214 and weighted average of 12.0%, a difference of 18.8%.
Divorced or Separated Correlation Summary
| Measurement | Seminole | Swiss |
| Minimum | 0.90% | 3.3% |
| Maximum | 34.0% | 40.9% |
| Range | 33.1% | 37.6% |
| Mean | 16.2% | 11.9% |
| Median | 16.1% | 11.0% |
| Interquartile 25% (IQ1) | 13.8% | 8.5% |
| Interquartile 75% (IQ3) | 19.0% | 12.4% |
| Interquartile Range (IQR) | 5.2% | 4.0% |
| Standard Deviation (Sample) | 5.4% | 7.0% |
| Standard Deviation (Population) | 5.3% | 6.9% |
Similar Demographics by Divorced or Separated
Demographics Similar to Seminole by Divorced or Separated
In terms of divorced or separated, the demographic groups most similar to Seminole are Bahamian (14.2%, a difference of 0.17%), Chickasaw (14.2%, a difference of 0.36%), Colville (14.2%, a difference of 0.40%), Choctaw (14.1%, a difference of 0.93%), and Creek (14.4%, a difference of 1.1%).
| Demographics | Rating | Rank | Divorced or Separated |
| Puerto Ricans | 0.0 /100 | #333 | Tragic 13.9% |
| Immigrants | Bahamas | 0.0 /100 | #334 | Tragic 13.9% |
| Dutch West Indians | 0.0 /100 | #335 | Tragic 14.0% |
| Shoshone | 0.0 /100 | #336 | Tragic 14.0% |
| Crow | 0.0 /100 | #337 | Tragic 14.1% |
| Choctaw | 0.0 /100 | #338 | Tragic 14.1% |
| Colville | 0.0 /100 | #339 | Tragic 14.2% |
| Chickasaw | 0.0 /100 | #340 | Tragic 14.2% |
| Bahamians | 0.0 /100 | #341 | Tragic 14.2% |
| Seminole | 0.0 /100 | #342 | Tragic 14.3% |
| Creek | 0.0 /100 | #343 | Tragic 14.4% |
| Cubans | 0.0 /100 | #344 | Tragic 14.5% |
| Kiowa | 0.0 /100 | #345 | Tragic 14.5% |
| Arapaho | 0.0 /100 | #346 | Tragic 14.8% |
| Immigrants | Cuba | 0.0 /100 | #347 | Tragic 15.2% |
Demographics Similar to Swiss by Divorced or Separated
In terms of divorced or separated, the demographic groups most similar to Swiss are Navajo (12.0%, a difference of 0.010%), Samoan (12.0%, a difference of 0.020%), Marshallese (12.0%, a difference of 0.040%), German Russian (12.0%, a difference of 0.070%), and Immigrants from Scotland (12.0%, a difference of 0.080%).
| Demographics | Rating | Rank | Divorced or Separated |
| Immigrants | Brazil | 68.8 /100 | #157 | Good 12.0% |
| Icelanders | 66.0 /100 | #158 | Good 12.0% |
| Immigrants | Barbados | 66.0 /100 | #159 | Good 12.0% |
| Immigrants | Scotland | 65.8 /100 | #160 | Good 12.0% |
| Marshallese | 64.6 /100 | #161 | Good 12.0% |
| Samoans | 64.3 /100 | #162 | Good 12.0% |
| Navajo | 63.9 /100 | #163 | Good 12.0% |
| Swiss | 63.6 /100 | #164 | Good 12.0% |
| German Russians | 61.8 /100 | #165 | Good 12.0% |
| Tohono O'odham | 60.4 /100 | #166 | Good 12.0% |
| Ethiopians | 58.5 /100 | #167 | Average 12.0% |
| Serbians | 57.1 /100 | #168 | Average 12.0% |
| Immigrants | Peru | 57.0 /100 | #169 | Average 12.0% |
| Mexican American Indians | 55.8 /100 | #170 | Average 12.0% |
| Costa Ricans | 53.3 /100 | #171 | Average 12.0% |