Nonimmigrants vs Arapaho Divorced or Separated
COMPARE
Nonimmigrants
Arapaho
Divorced or Separated
Divorced or Separated Comparison
Nonimmigrants
Arapaho
12.8%
DIVORCED OR SEPARATED
0.1/ 100
METRIC RATING
284th/ 347
METRIC RANK
14.8%
DIVORCED OR SEPARATED
0.0/ 100
METRIC RATING
346th/ 347
METRIC RANK
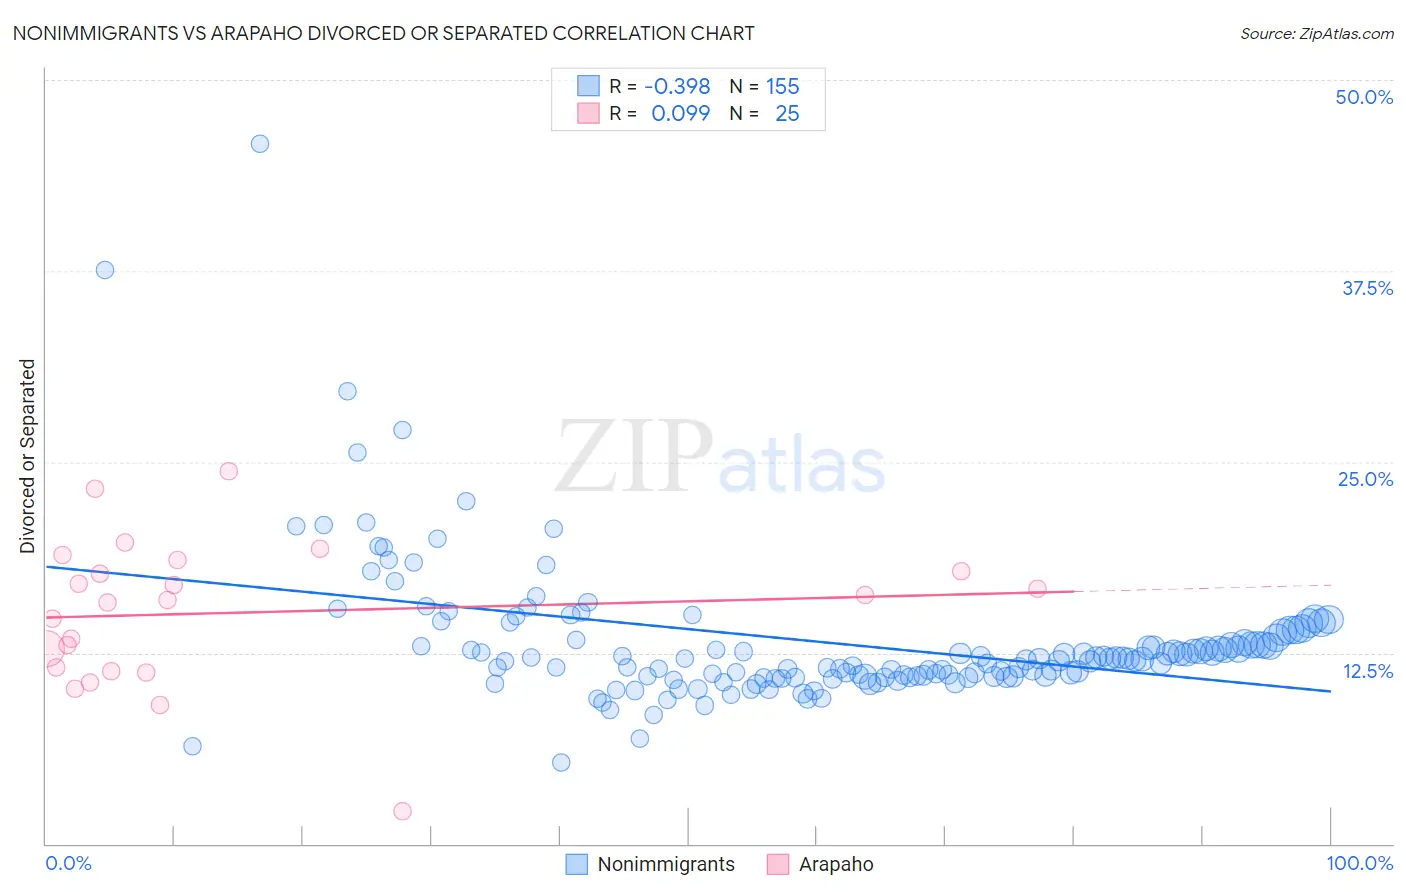
Nonimmigrants vs Arapaho Divorced or Separated Correlation Chart
The statistical analysis conducted on geographies consisting of 584,532,053 people shows a mild negative correlation between the proportion of Nonimmigrants and percentage of population currently divorced or separated in the United States with a correlation coefficient (R) of -0.398 and weighted average of 12.8%. Similarly, the statistical analysis conducted on geographies consisting of 29,779,242 people shows a slight positive correlation between the proportion of Arapaho and percentage of population currently divorced or separated in the United States with a correlation coefficient (R) of 0.099 and weighted average of 14.8%, a difference of 16.2%.
Divorced or Separated Correlation Summary
| Measurement | Nonimmigrants | Arapaho |
| Minimum | 5.3% | 2.1% |
| Maximum | 45.8% | 24.4% |
| Range | 40.5% | 22.3% |
| Mean | 13.2% | 15.1% |
| Median | 12.1% | 15.9% |
| Interquartile 25% (IQ1) | 10.9% | 11.4% |
| Interquartile 75% (IQ3) | 13.5% | 18.2% |
| Interquartile Range (IQR) | 2.6% | 6.8% |
| Standard Deviation (Sample) | 4.8% | 4.8% |
| Standard Deviation (Population) | 4.8% | 4.7% |
Similar Demographics by Divorced or Separated
Demographics Similar to Nonimmigrants by Divorced or Separated
In terms of divorced or separated, the demographic groups most similar to Nonimmigrants are French (12.8%, a difference of 0.040%), Delaware (12.7%, a difference of 0.090%), Subsaharan African (12.7%, a difference of 0.10%), Pueblo (12.7%, a difference of 0.22%), and Immigrants from Zaire (12.7%, a difference of 0.26%).
| Demographics | Rating | Rank | Divorced or Separated |
| Dominicans | 0.2 /100 | #277 | Tragic 12.7% |
| Lumbee | 0.2 /100 | #278 | Tragic 12.7% |
| Immigrants | Dominican Republic | 0.2 /100 | #279 | Tragic 12.7% |
| Immigrants | Zaire | 0.2 /100 | #280 | Tragic 12.7% |
| Pueblo | 0.2 /100 | #281 | Tragic 12.7% |
| Sub-Saharan Africans | 0.1 /100 | #282 | Tragic 12.7% |
| Delaware | 0.1 /100 | #283 | Tragic 12.7% |
| Immigrants | Nonimmigrants | 0.1 /100 | #284 | Tragic 12.8% |
| French | 0.1 /100 | #285 | Tragic 12.8% |
| Spanish | 0.1 /100 | #286 | Tragic 12.8% |
| Hondurans | 0.1 /100 | #287 | Tragic 12.8% |
| French Canadians | 0.1 /100 | #288 | Tragic 12.8% |
| Iroquois | 0.0 /100 | #289 | Tragic 12.9% |
| Pima | 0.0 /100 | #290 | Tragic 12.9% |
| Immigrants | Honduras | 0.0 /100 | #291 | Tragic 12.9% |
Demographics Similar to Arapaho by Divorced or Separated
In terms of divorced or separated, the demographic groups most similar to Arapaho are Kiowa (14.5%, a difference of 2.1%), Cuban (14.5%, a difference of 2.2%), Immigrants from Cuba (15.2%, a difference of 2.8%), Creek (14.4%, a difference of 2.9%), and Seminole (14.3%, a difference of 3.9%).
| Demographics | Rating | Rank | Divorced or Separated |
| Puerto Ricans | 0.0 /100 | #333 | Tragic 13.9% |
| Immigrants | Bahamas | 0.0 /100 | #334 | Tragic 13.9% |
| Dutch West Indians | 0.0 /100 | #335 | Tragic 14.0% |
| Shoshone | 0.0 /100 | #336 | Tragic 14.0% |
| Crow | 0.0 /100 | #337 | Tragic 14.1% |
| Choctaw | 0.0 /100 | #338 | Tragic 14.1% |
| Colville | 0.0 /100 | #339 | Tragic 14.2% |
| Chickasaw | 0.0 /100 | #340 | Tragic 14.2% |
| Bahamians | 0.0 /100 | #341 | Tragic 14.2% |
| Seminole | 0.0 /100 | #342 | Tragic 14.3% |
| Creek | 0.0 /100 | #343 | Tragic 14.4% |
| Cubans | 0.0 /100 | #344 | Tragic 14.5% |
| Kiowa | 0.0 /100 | #345 | Tragic 14.5% |
| Arapaho | 0.0 /100 | #346 | Tragic 14.8% |
| Immigrants | Cuba | 0.0 /100 | #347 | Tragic 15.2% |