Nonimmigrants vs Cape Verdean Divorced or Separated
COMPARE
Nonimmigrants
Cape Verdean
Divorced or Separated
Divorced or Separated Comparison
Nonimmigrants
Cape Verdeans
12.8%
DIVORCED OR SEPARATED
0.1/ 100
METRIC RATING
284th/ 347
METRIC RANK
13.1%
DIVORCED OR SEPARATED
0.0/ 100
METRIC RATING
303rd/ 347
METRIC RANK
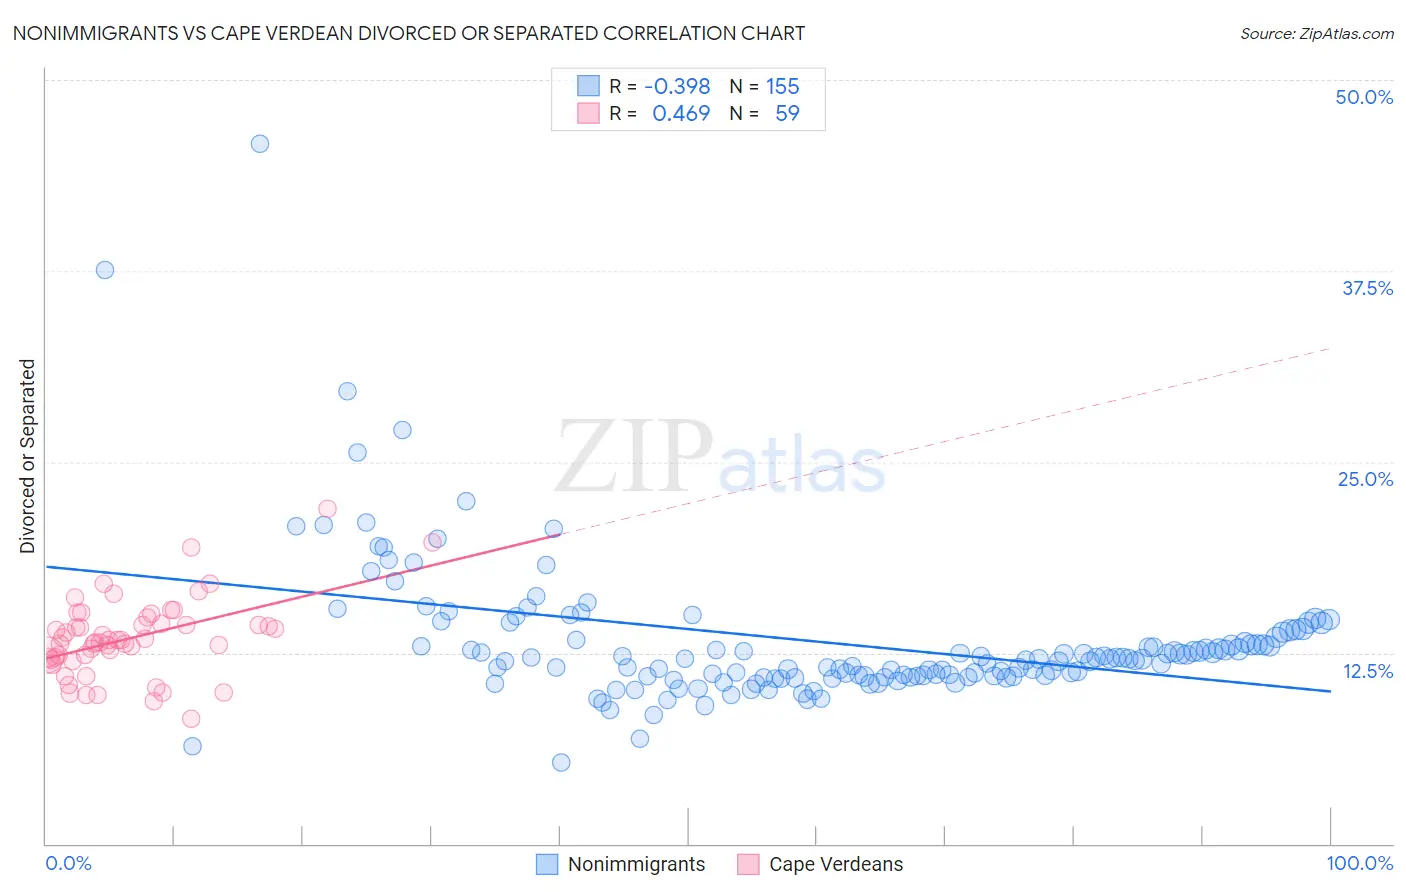
Nonimmigrants vs Cape Verdean Divorced or Separated Correlation Chart
The statistical analysis conducted on geographies consisting of 584,532,053 people shows a mild negative correlation between the proportion of Nonimmigrants and percentage of population currently divorced or separated in the United States with a correlation coefficient (R) of -0.398 and weighted average of 12.8%. Similarly, the statistical analysis conducted on geographies consisting of 107,557,736 people shows a moderate positive correlation between the proportion of Cape Verdeans and percentage of population currently divorced or separated in the United States with a correlation coefficient (R) of 0.469 and weighted average of 13.1%, a difference of 3.0%.
Divorced or Separated Correlation Summary
| Measurement | Nonimmigrants | Cape Verdean |
| Minimum | 5.3% | 8.2% |
| Maximum | 45.8% | 21.9% |
| Range | 40.5% | 13.7% |
| Mean | 13.2% | 13.4% |
| Median | 12.1% | 13.3% |
| Interquartile 25% (IQ1) | 10.9% | 12.2% |
| Interquartile 75% (IQ3) | 13.5% | 14.4% |
| Interquartile Range (IQR) | 2.6% | 2.2% |
| Standard Deviation (Sample) | 4.8% | 2.6% |
| Standard Deviation (Population) | 4.8% | 2.5% |
Demographics Similar to Nonimmigrants and Cape Verdeans by Divorced or Separated
In terms of divorced or separated, the demographic groups most similar to Nonimmigrants are French (12.8%, a difference of 0.040%), Delaware (12.7%, a difference of 0.090%), Spanish (12.8%, a difference of 0.26%), Honduran (12.8%, a difference of 0.45%), and French Canadian (12.8%, a difference of 0.71%). Similarly, the demographic groups most similar to Cape Verdeans are Immigrants from Venezuela (13.1%, a difference of 0.020%), Alaskan Athabascan (13.1%, a difference of 0.12%), Immigrants from Cabo Verde (13.1%, a difference of 0.33%), Immigrants from Jamaica (13.0%, a difference of 0.88%), and Venezuelan (13.0%, a difference of 0.91%).
| Demographics | Rating | Rank | Divorced or Separated |
| Delaware | 0.1 /100 | #283 | Tragic 12.7% |
| Immigrants | Nonimmigrants | 0.1 /100 | #284 | Tragic 12.8% |
| French | 0.1 /100 | #285 | Tragic 12.8% |
| Spanish | 0.1 /100 | #286 | Tragic 12.8% |
| Hondurans | 0.1 /100 | #287 | Tragic 12.8% |
| French Canadians | 0.1 /100 | #288 | Tragic 12.8% |
| Iroquois | 0.0 /100 | #289 | Tragic 12.9% |
| Pima | 0.0 /100 | #290 | Tragic 12.9% |
| Immigrants | Honduras | 0.0 /100 | #291 | Tragic 12.9% |
| Scotch-Irish | 0.0 /100 | #292 | Tragic 12.9% |
| Jamaicans | 0.0 /100 | #293 | Tragic 12.9% |
| Apache | 0.0 /100 | #294 | Tragic 12.9% |
| Celtics | 0.0 /100 | #295 | Tragic 13.0% |
| Nicaraguans | 0.0 /100 | #296 | Tragic 13.0% |
| Natives/Alaskans | 0.0 /100 | #297 | Tragic 13.0% |
| Venezuelans | 0.0 /100 | #298 | Tragic 13.0% |
| Immigrants | Jamaica | 0.0 /100 | #299 | Tragic 13.0% |
| Immigrants | Cabo Verde | 0.0 /100 | #300 | Tragic 13.1% |
| Alaskan Athabascans | 0.0 /100 | #301 | Tragic 13.1% |
| Immigrants | Venezuela | 0.0 /100 | #302 | Tragic 13.1% |
| Cape Verdeans | 0.0 /100 | #303 | Tragic 13.1% |