Carpatho Rusyn vs Swiss Divorced or Separated
COMPARE
Carpatho Rusyn
Swiss
Divorced or Separated
Divorced or Separated Comparison
Carpatho Rusyns
Swiss
11.9%
DIVORCED OR SEPARATED
84.8/ 100
METRIC RATING
136th/ 347
METRIC RANK
12.0%
DIVORCED OR SEPARATED
63.6/ 100
METRIC RATING
164th/ 347
METRIC RANK
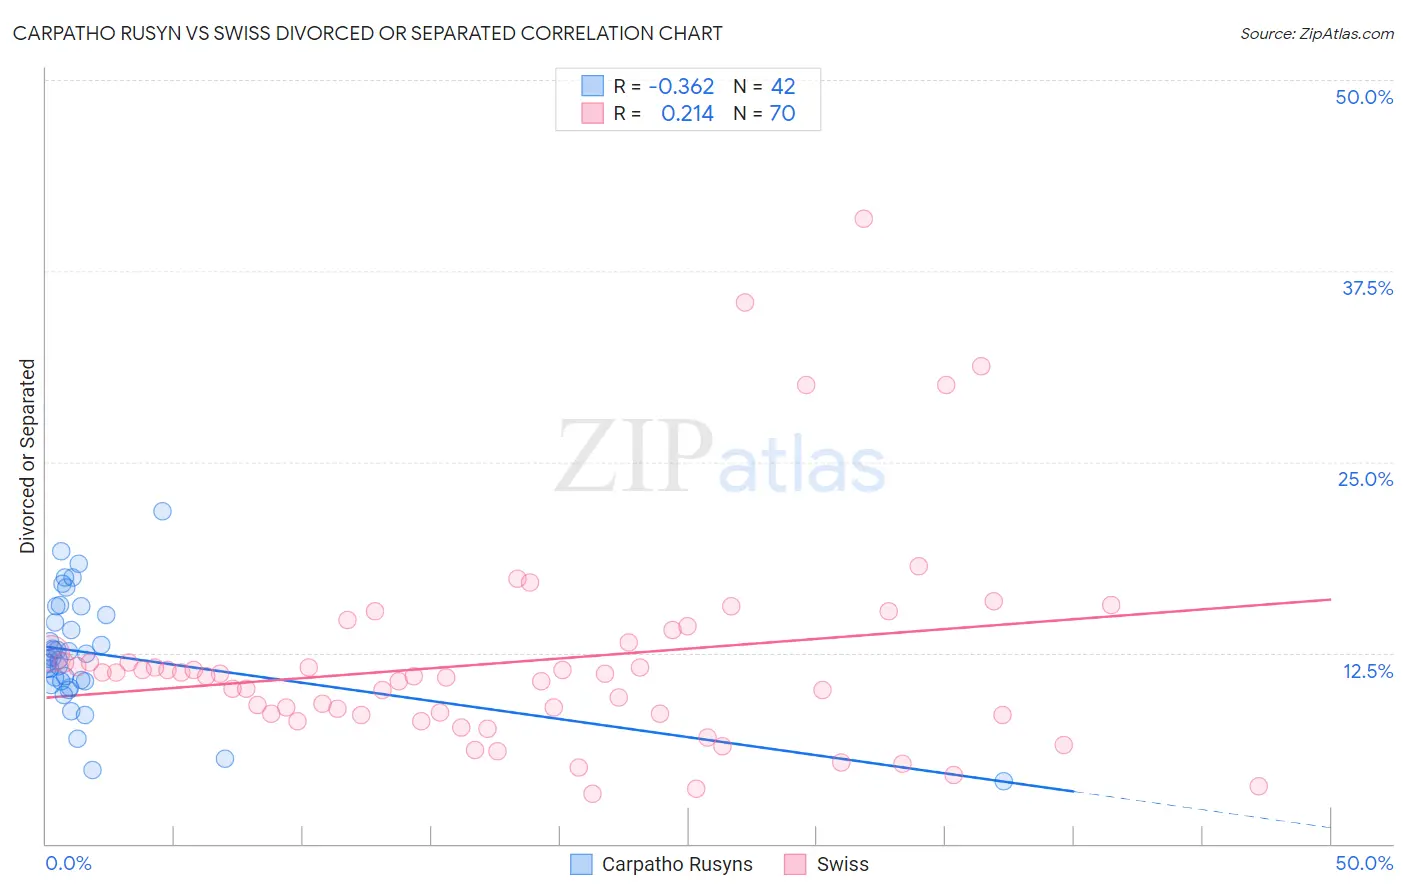
Carpatho Rusyn vs Swiss Divorced or Separated Correlation Chart
The statistical analysis conducted on geographies consisting of 58,871,690 people shows a mild negative correlation between the proportion of Carpatho Rusyns and percentage of population currently divorced or separated in the United States with a correlation coefficient (R) of -0.362 and weighted average of 11.9%. Similarly, the statistical analysis conducted on geographies consisting of 464,828,209 people shows a weak positive correlation between the proportion of Swiss and percentage of population currently divorced or separated in the United States with a correlation coefficient (R) of 0.214 and weighted average of 12.0%, a difference of 1.0%.
Divorced or Separated Correlation Summary
| Measurement | Carpatho Rusyn | Swiss |
| Minimum | 4.1% | 3.3% |
| Maximum | 21.8% | 40.9% |
| Range | 17.7% | 37.6% |
| Mean | 12.5% | 11.9% |
| Median | 12.1% | 11.0% |
| Interquartile 25% (IQ1) | 10.6% | 8.5% |
| Interquartile 75% (IQ3) | 15.0% | 12.4% |
| Interquartile Range (IQR) | 4.4% | 4.0% |
| Standard Deviation (Sample) | 3.7% | 7.0% |
| Standard Deviation (Population) | 3.7% | 6.9% |
Similar Demographics by Divorced or Separated
Demographics Similar to Carpatho Rusyns by Divorced or Separated
In terms of divorced or separated, the demographic groups most similar to Carpatho Rusyns are Danish (11.9%, a difference of 0.0%), Argentinean (11.9%, a difference of 0.020%), Alsatian (11.9%, a difference of 0.060%), Immigrants from Netherlands (11.9%, a difference of 0.060%), and Australian (11.9%, a difference of 0.080%).
| Demographics | Rating | Rank | Divorced or Separated |
| Immigrants | St. Vincent and the Grenadines | 88.4 /100 | #129 | Excellent 11.8% |
| Immigrants | Austria | 88.2 /100 | #130 | Excellent 11.8% |
| Immigrants | Cambodia | 88.2 /100 | #131 | Excellent 11.8% |
| Immigrants | Afghanistan | 87.9 /100 | #132 | Excellent 11.8% |
| New Zealanders | 87.5 /100 | #133 | Excellent 11.9% |
| Argentineans | 85.1 /100 | #134 | Excellent 11.9% |
| Danes | 84.8 /100 | #135 | Excellent 11.9% |
| Carpatho Rusyns | 84.8 /100 | #136 | Excellent 11.9% |
| Alsatians | 84.0 /100 | #137 | Excellent 11.9% |
| Immigrants | Netherlands | 83.9 /100 | #138 | Excellent 11.9% |
| Australians | 83.6 /100 | #139 | Excellent 11.9% |
| Lebanese | 83.4 /100 | #140 | Excellent 11.9% |
| Immigrants | Morocco | 82.9 /100 | #141 | Excellent 11.9% |
| Immigrants | Zimbabwe | 81.5 /100 | #142 | Excellent 11.9% |
| Pakistanis | 81.3 /100 | #143 | Excellent 11.9% |
Demographics Similar to Swiss by Divorced or Separated
In terms of divorced or separated, the demographic groups most similar to Swiss are Navajo (12.0%, a difference of 0.010%), Samoan (12.0%, a difference of 0.020%), Marshallese (12.0%, a difference of 0.040%), German Russian (12.0%, a difference of 0.070%), and Immigrants from Scotland (12.0%, a difference of 0.080%).
| Demographics | Rating | Rank | Divorced or Separated |
| Immigrants | Brazil | 68.8 /100 | #157 | Good 12.0% |
| Icelanders | 66.0 /100 | #158 | Good 12.0% |
| Immigrants | Barbados | 66.0 /100 | #159 | Good 12.0% |
| Immigrants | Scotland | 65.8 /100 | #160 | Good 12.0% |
| Marshallese | 64.6 /100 | #161 | Good 12.0% |
| Samoans | 64.3 /100 | #162 | Good 12.0% |
| Navajo | 63.9 /100 | #163 | Good 12.0% |
| Swiss | 63.6 /100 | #164 | Good 12.0% |
| German Russians | 61.8 /100 | #165 | Good 12.0% |
| Tohono O'odham | 60.4 /100 | #166 | Good 12.0% |
| Ethiopians | 58.5 /100 | #167 | Average 12.0% |
| Serbians | 57.1 /100 | #168 | Average 12.0% |
| Immigrants | Peru | 57.0 /100 | #169 | Average 12.0% |
| Mexican American Indians | 55.8 /100 | #170 | Average 12.0% |
| Costa Ricans | 53.3 /100 | #171 | Average 12.0% |