Immigrants from Ethiopia vs Swiss Divorced or Separated
COMPARE
Immigrants from Ethiopia
Swiss
Divorced or Separated
Divorced or Separated Comparison
Immigrants from Ethiopia
Swiss
12.1%
DIVORCED OR SEPARATED
43.1/ 100
METRIC RATING
182nd/ 347
METRIC RANK
12.0%
DIVORCED OR SEPARATED
63.6/ 100
METRIC RATING
164th/ 347
METRIC RANK
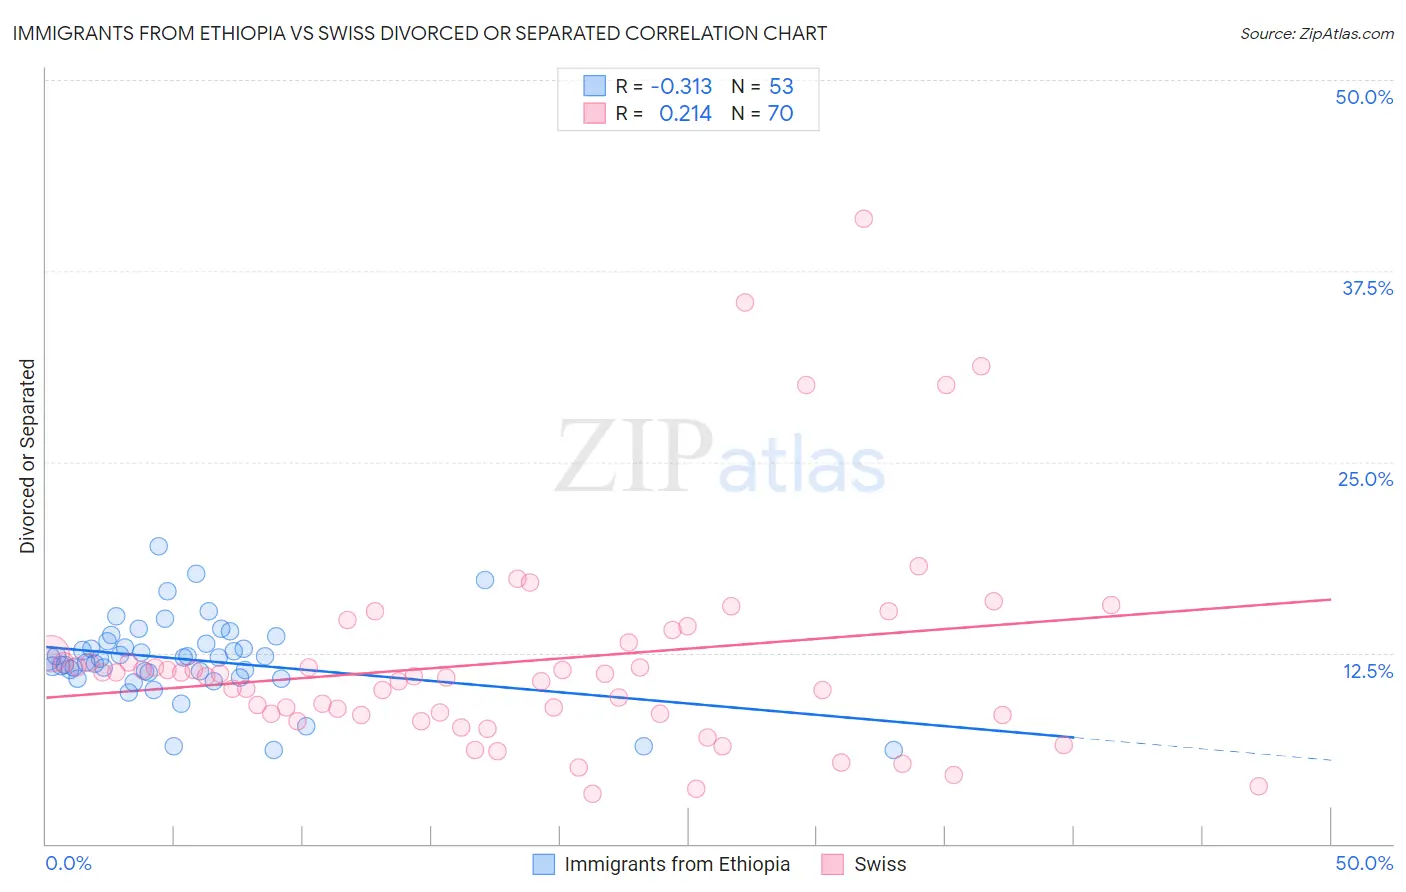
Immigrants from Ethiopia vs Swiss Divorced or Separated Correlation Chart
The statistical analysis conducted on geographies consisting of 211,499,427 people shows a mild negative correlation between the proportion of Immigrants from Ethiopia and percentage of population currently divorced or separated in the United States with a correlation coefficient (R) of -0.313 and weighted average of 12.1%. Similarly, the statistical analysis conducted on geographies consisting of 464,828,209 people shows a weak positive correlation between the proportion of Swiss and percentage of population currently divorced or separated in the United States with a correlation coefficient (R) of 0.214 and weighted average of 12.0%, a difference of 0.73%.
Divorced or Separated Correlation Summary
| Measurement | Immigrants from Ethiopia | Swiss |
| Minimum | 6.1% | 3.3% |
| Maximum | 19.5% | 40.9% |
| Range | 13.4% | 37.6% |
| Mean | 12.1% | 11.9% |
| Median | 12.1% | 11.0% |
| Interquartile 25% (IQ1) | 11.1% | 8.5% |
| Interquartile 75% (IQ3) | 13.2% | 12.4% |
| Interquartile Range (IQR) | 2.1% | 4.0% |
| Standard Deviation (Sample) | 2.7% | 7.0% |
| Standard Deviation (Population) | 2.6% | 6.9% |
Demographics Similar to Immigrants from Ethiopia and Swiss by Divorced or Separated
In terms of divorced or separated, the demographic groups most similar to Immigrants from Ethiopia are Immigrants from Central America (12.1%, a difference of 0.010%), Immigrants from Canada (12.1%, a difference of 0.030%), Barbadian (12.1%, a difference of 0.070%), Immigrants from Western Europe (12.1%, a difference of 0.090%), and Ghanaian (12.1%, a difference of 0.10%). Similarly, the demographic groups most similar to Swiss are Navajo (12.0%, a difference of 0.010%), German Russian (12.0%, a difference of 0.070%), Tohono O'odham (12.0%, a difference of 0.12%), Ethiopian (12.0%, a difference of 0.19%), and Serbian (12.0%, a difference of 0.24%).
| Demographics | Rating | Rank | Divorced or Separated |
| Navajo | 63.9 /100 | #163 | Good 12.0% |
| Swiss | 63.6 /100 | #164 | Good 12.0% |
| German Russians | 61.8 /100 | #165 | Good 12.0% |
| Tohono O'odham | 60.4 /100 | #166 | Good 12.0% |
| Ethiopians | 58.5 /100 | #167 | Average 12.0% |
| Serbians | 57.1 /100 | #168 | Average 12.0% |
| Immigrants | Peru | 57.0 /100 | #169 | Average 12.0% |
| Mexican American Indians | 55.8 /100 | #170 | Average 12.0% |
| Costa Ricans | 53.3 /100 | #171 | Average 12.0% |
| Immigrants | Mexico | 53.2 /100 | #172 | Average 12.0% |
| Immigrants | Moldova | 50.4 /100 | #173 | Average 12.1% |
| Hawaiians | 50.0 /100 | #174 | Average 12.1% |
| Immigrants | Sierra Leone | 50.0 /100 | #175 | Average 12.1% |
| Pennsylvania Germans | 48.9 /100 | #176 | Average 12.1% |
| Brazilians | 47.7 /100 | #177 | Average 12.1% |
| Ghanaians | 45.9 /100 | #178 | Average 12.1% |
| Immigrants | Western Europe | 45.6 /100 | #179 | Average 12.1% |
| Barbadians | 45.0 /100 | #180 | Average 12.1% |
| Immigrants | Canada | 44.0 /100 | #181 | Average 12.1% |
| Immigrants | Ethiopia | 43.1 /100 | #182 | Average 12.1% |
| Immigrants | Central America | 42.9 /100 | #183 | Average 12.1% |