Nicaraguan vs Lebanese Currently Married
COMPARE
Nicaraguan
Lebanese
Currently Married
Currently Married Comparison
Nicaraguans
Lebanese
44.2%
CURRENTLY MARRIED
0.3/ 100
METRIC RATING
248th/ 347
METRIC RANK
47.9%
CURRENTLY MARRIED
95.1/ 100
METRIC RATING
93rd/ 347
METRIC RANK
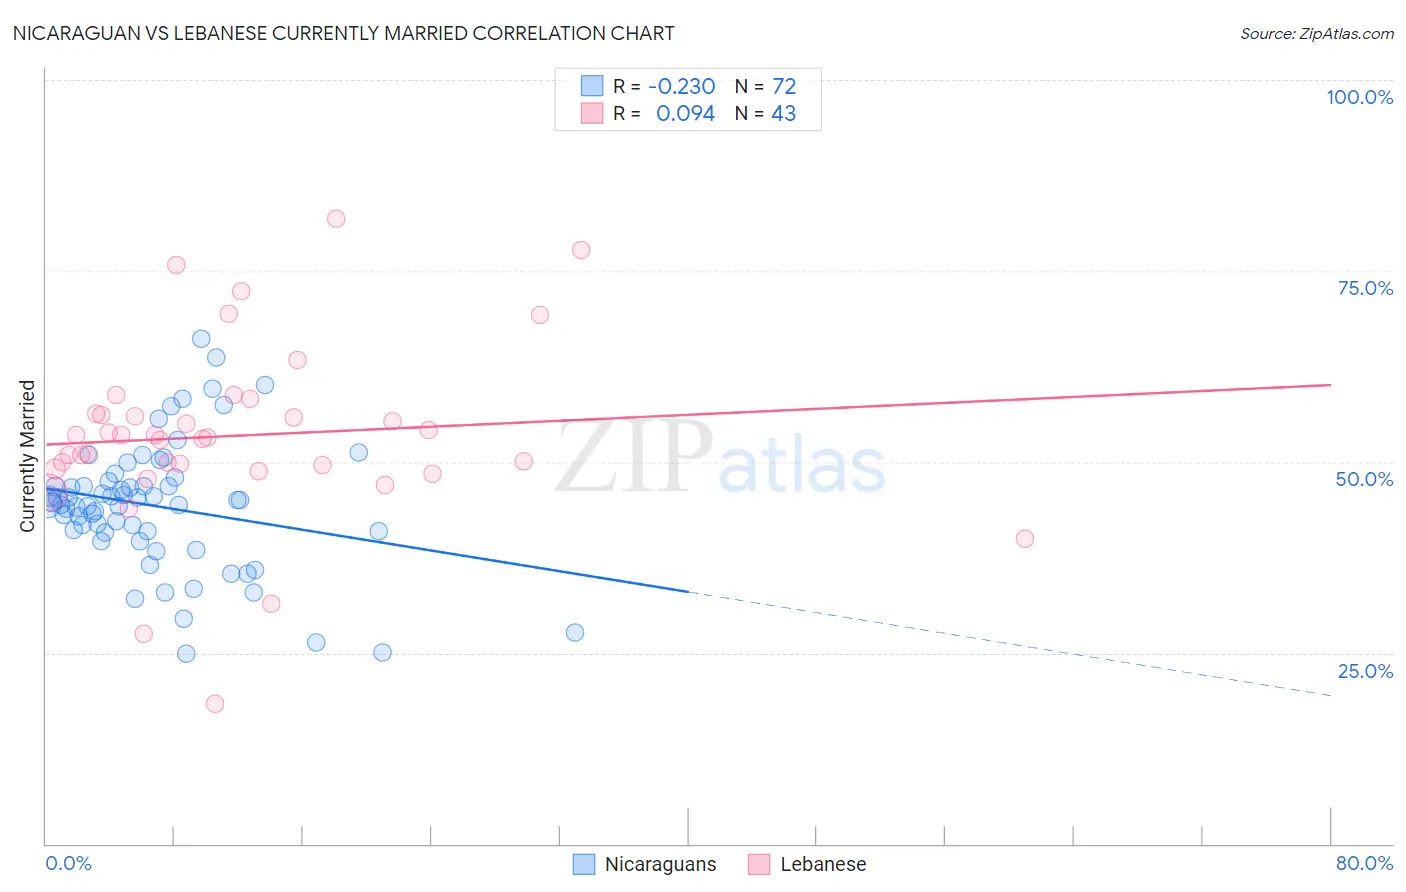
Nicaraguan vs Lebanese Currently Married Correlation Chart
The statistical analysis conducted on geographies consisting of 285,678,728 people shows a weak negative correlation between the proportion of Nicaraguans and percentage of population currently married in the United States with a correlation coefficient (R) of -0.230 and weighted average of 44.2%. Similarly, the statistical analysis conducted on geographies consisting of 401,555,158 people shows a slight positive correlation between the proportion of Lebanese and percentage of population currently married in the United States with a correlation coefficient (R) of 0.094 and weighted average of 47.9%, a difference of 8.4%.
Currently Married Correlation Summary
| Measurement | Nicaraguan | Lebanese |
| Minimum | 24.9% | 18.3% |
| Maximum | 66.1% | 81.9% |
| Range | 41.2% | 63.6% |
| Mean | 44.2% | 53.4% |
| Median | 44.6% | 53.2% |
| Interquartile 25% (IQ1) | 40.9% | 49.1% |
| Interquartile 75% (IQ3) | 47.2% | 56.3% |
| Interquartile Range (IQR) | 6.3% | 7.3% |
| Standard Deviation (Sample) | 8.4% | 11.9% |
| Standard Deviation (Population) | 8.3% | 11.7% |
Similar Demographics by Currently Married
Demographics Similar to Nicaraguans by Currently Married
In terms of currently married, the demographic groups most similar to Nicaraguans are Immigrants from Cameroon (44.2%, a difference of 0.020%), Immigrants from Eastern Africa (44.2%, a difference of 0.040%), Ugandan (44.2%, a difference of 0.090%), Blackfeet (44.2%, a difference of 0.10%), and Hispanic or Latino (44.1%, a difference of 0.12%).
| Demographics | Rating | Rank | Currently Married |
| Ethiopians | 0.7 /100 | #241 | Tragic 44.5% |
| Immigrants | Cambodia | 0.7 /100 | #242 | Tragic 44.5% |
| Immigrants | Ethiopia | 0.7 /100 | #243 | Tragic 44.5% |
| Japanese | 0.6 /100 | #244 | Tragic 44.5% |
| Immigrants | Armenia | 0.4 /100 | #245 | Tragic 44.3% |
| Immigrants | Burma/Myanmar | 0.4 /100 | #246 | Tragic 44.3% |
| Ugandans | 0.4 /100 | #247 | Tragic 44.2% |
| Nicaraguans | 0.3 /100 | #248 | Tragic 44.2% |
| Immigrants | Cameroon | 0.3 /100 | #249 | Tragic 44.2% |
| Immigrants | Eastern Africa | 0.3 /100 | #250 | Tragic 44.2% |
| Blackfeet | 0.3 /100 | #251 | Tragic 44.2% |
| Hispanics or Latinos | 0.3 /100 | #252 | Tragic 44.1% |
| Immigrants | Central America | 0.3 /100 | #253 | Tragic 44.1% |
| Vietnamese | 0.2 /100 | #254 | Tragic 44.0% |
| Yakama | 0.2 /100 | #255 | Tragic 44.0% |
Demographics Similar to Lebanese by Currently Married
In terms of currently married, the demographic groups most similar to Lebanese are Native Hawaiian (47.9%, a difference of 0.010%), Korean (47.9%, a difference of 0.050%), Immigrants from Bulgaria (47.9%, a difference of 0.050%), Egyptian (47.9%, a difference of 0.050%), and Immigrants from Ukraine (47.9%, a difference of 0.060%).
| Demographics | Rating | Rank | Currently Married |
| Immigrants | Japan | 96.2 /100 | #86 | Exceptional 48.0% |
| Jordanians | 96.2 /100 | #87 | Exceptional 48.0% |
| Immigrants | Eastern Europe | 96.1 /100 | #88 | Exceptional 48.0% |
| Indians (Asian) | 95.8 /100 | #89 | Exceptional 48.0% |
| Americans | 95.7 /100 | #90 | Exceptional 48.0% |
| Immigrants | Bolivia | 95.6 /100 | #91 | Exceptional 47.9% |
| Koreans | 95.4 /100 | #92 | Exceptional 47.9% |
| Lebanese | 95.1 /100 | #93 | Exceptional 47.9% |
| Native Hawaiians | 95.0 /100 | #94 | Exceptional 47.9% |
| Immigrants | Bulgaria | 94.8 /100 | #95 | Exceptional 47.9% |
| Egyptians | 94.8 /100 | #96 | Exceptional 47.9% |
| Immigrants | Ukraine | 94.8 /100 | #97 | Exceptional 47.9% |
| Immigrants | China | 94.7 /100 | #98 | Exceptional 47.9% |
| Immigrants | Sweden | 94.3 /100 | #99 | Exceptional 47.8% |
| Celtics | 94.2 /100 | #100 | Exceptional 47.8% |