Nicaraguan vs Tlingit-Haida Currently Married
COMPARE
Nicaraguan
Tlingit-Haida
Currently Married
Currently Married Comparison
Nicaraguans
Tlingit-Haida
44.2%
CURRENTLY MARRIED
0.3/ 100
METRIC RATING
248th/ 347
METRIC RANK
46.7%
CURRENTLY MARRIED
51.2/ 100
METRIC RATING
173rd/ 347
METRIC RANK
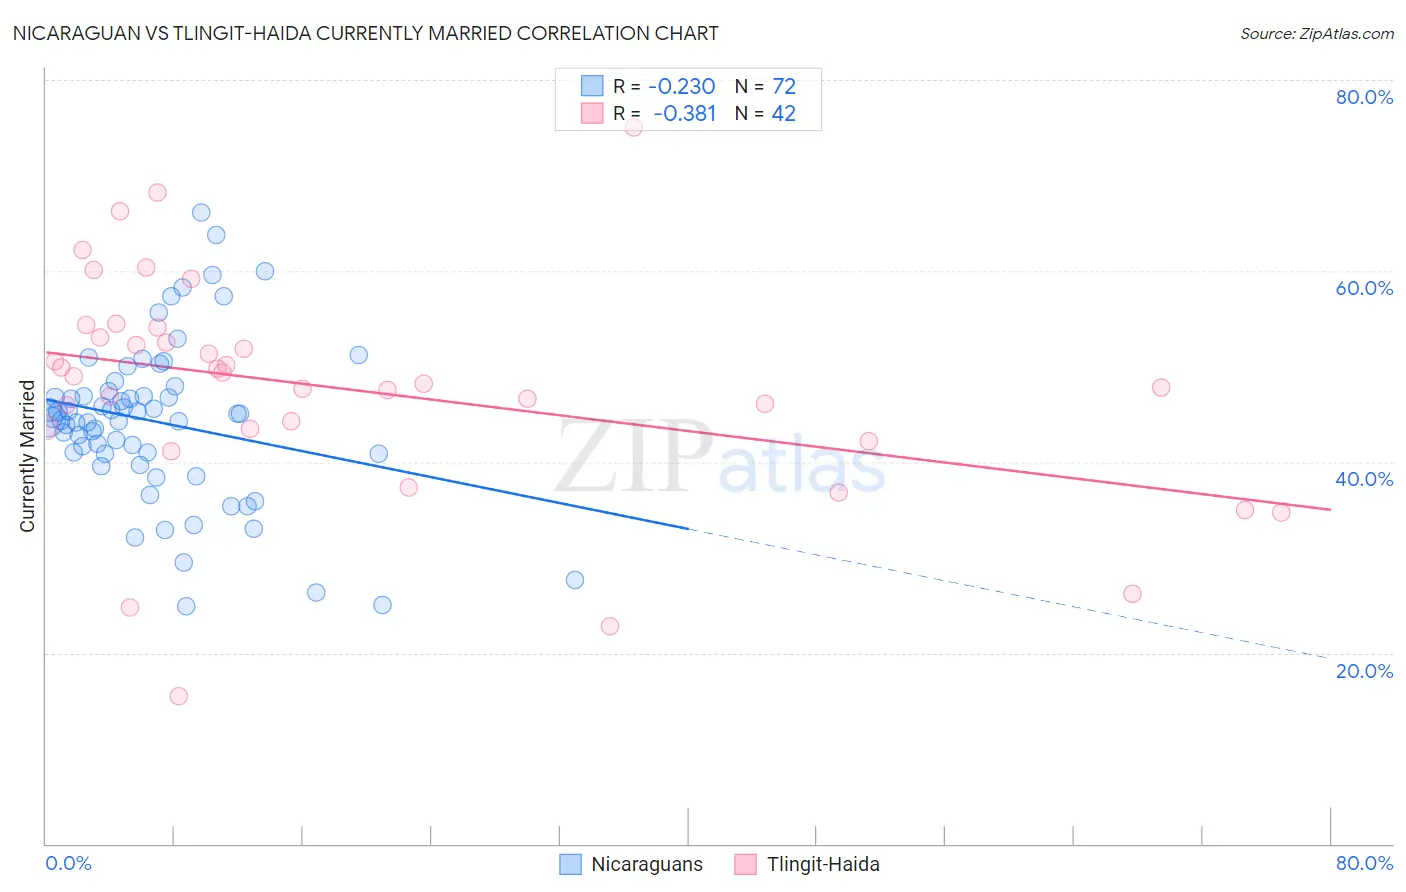
Nicaraguan vs Tlingit-Haida Currently Married Correlation Chart
The statistical analysis conducted on geographies consisting of 285,678,728 people shows a weak negative correlation between the proportion of Nicaraguans and percentage of population currently married in the United States with a correlation coefficient (R) of -0.230 and weighted average of 44.2%. Similarly, the statistical analysis conducted on geographies consisting of 60,872,339 people shows a mild negative correlation between the proportion of Tlingit-Haida and percentage of population currently married in the United States with a correlation coefficient (R) of -0.381 and weighted average of 46.7%, a difference of 5.5%.
Currently Married Correlation Summary
| Measurement | Nicaraguan | Tlingit-Haida |
| Minimum | 24.9% | 15.4% |
| Maximum | 66.1% | 75.0% |
| Range | 41.2% | 59.6% |
| Mean | 44.2% | 47.6% |
| Median | 44.6% | 48.6% |
| Interquartile 25% (IQ1) | 40.9% | 43.5% |
| Interquartile 75% (IQ3) | 47.2% | 53.1% |
| Interquartile Range (IQR) | 6.3% | 9.6% |
| Standard Deviation (Sample) | 8.4% | 11.9% |
| Standard Deviation (Population) | 8.3% | 11.7% |
Similar Demographics by Currently Married
Demographics Similar to Nicaraguans by Currently Married
In terms of currently married, the demographic groups most similar to Nicaraguans are Immigrants from Cameroon (44.2%, a difference of 0.020%), Immigrants from Eastern Africa (44.2%, a difference of 0.040%), Ugandan (44.2%, a difference of 0.090%), Blackfeet (44.2%, a difference of 0.10%), and Hispanic or Latino (44.1%, a difference of 0.12%).
| Demographics | Rating | Rank | Currently Married |
| Ethiopians | 0.7 /100 | #241 | Tragic 44.5% |
| Immigrants | Cambodia | 0.7 /100 | #242 | Tragic 44.5% |
| Immigrants | Ethiopia | 0.7 /100 | #243 | Tragic 44.5% |
| Japanese | 0.6 /100 | #244 | Tragic 44.5% |
| Immigrants | Armenia | 0.4 /100 | #245 | Tragic 44.3% |
| Immigrants | Burma/Myanmar | 0.4 /100 | #246 | Tragic 44.3% |
| Ugandans | 0.4 /100 | #247 | Tragic 44.2% |
| Nicaraguans | 0.3 /100 | #248 | Tragic 44.2% |
| Immigrants | Cameroon | 0.3 /100 | #249 | Tragic 44.2% |
| Immigrants | Eastern Africa | 0.3 /100 | #250 | Tragic 44.2% |
| Blackfeet | 0.3 /100 | #251 | Tragic 44.2% |
| Hispanics or Latinos | 0.3 /100 | #252 | Tragic 44.1% |
| Immigrants | Central America | 0.3 /100 | #253 | Tragic 44.1% |
| Vietnamese | 0.2 /100 | #254 | Tragic 44.0% |
| Yakama | 0.2 /100 | #255 | Tragic 44.0% |
Demographics Similar to Tlingit-Haida by Currently Married
In terms of currently married, the demographic groups most similar to Tlingit-Haida are Aleut (46.7%, a difference of 0.030%), Peruvian (46.6%, a difference of 0.040%), Immigrants from Zimbabwe (46.7%, a difference of 0.050%), Immigrants from Brazil (46.6%, a difference of 0.050%), and Hawaiian (46.6%, a difference of 0.090%).
| Demographics | Rating | Rank | Currently Married |
| Immigrants | Syria | 59.3 /100 | #166 | Average 46.8% |
| Spaniards | 58.8 /100 | #167 | Average 46.8% |
| Immigrants | Afghanistan | 58.2 /100 | #168 | Average 46.8% |
| Armenians | 58.2 /100 | #169 | Average 46.8% |
| Immigrants | Latvia | 56.7 /100 | #170 | Average 46.7% |
| Immigrants | Zimbabwe | 52.4 /100 | #171 | Average 46.7% |
| Aleuts | 52.0 /100 | #172 | Average 46.7% |
| Tlingit-Haida | 51.2 /100 | #173 | Average 46.7% |
| Peruvians | 50.0 /100 | #174 | Average 46.6% |
| Immigrants | Brazil | 49.9 /100 | #175 | Average 46.6% |
| Hawaiians | 48.6 /100 | #176 | Average 46.6% |
| Israelis | 48.6 /100 | #177 | Average 46.6% |
| Chickasaw | 47.8 /100 | #178 | Average 46.6% |
| Immigrants | Oceania | 44.6 /100 | #179 | Average 46.5% |
| Costa Ricans | 43.7 /100 | #180 | Average 46.5% |