African vs Immigrants from St. Vincent and the Grenadines Married-couple Households
COMPARE
African
Immigrants from St. Vincent and the Grenadines
Married-couple Households
Married-couple Households Comparison
Africans
Immigrants from St. Vincent and the Grenadines
40.9%
MARRIED-COUPLE HOUSEHOLDS
0.0/ 100
METRIC RATING
312th/ 347
METRIC RANK
38.7%
MARRIED-COUPLE HOUSEHOLDS
0.0/ 100
METRIC RATING
334th/ 347
METRIC RANK
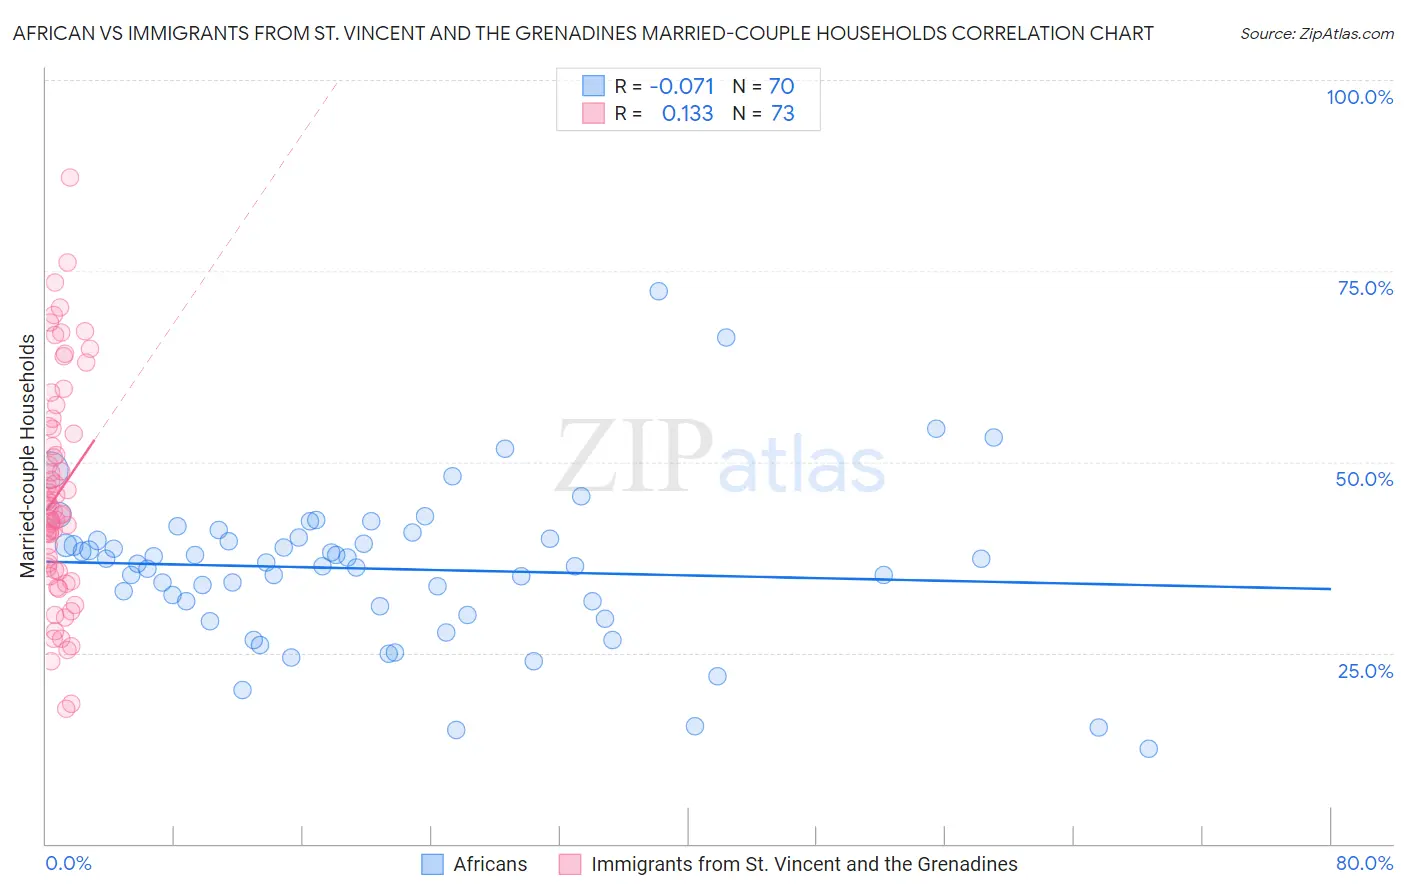
African vs Immigrants from St. Vincent and the Grenadines Married-couple Households Correlation Chart
The statistical analysis conducted on geographies consisting of 469,585,166 people shows a slight negative correlation between the proportion of Africans and percentage of married-couple family households in the United States with a correlation coefficient (R) of -0.071 and weighted average of 40.9%. Similarly, the statistical analysis conducted on geographies consisting of 56,188,620 people shows a poor positive correlation between the proportion of Immigrants from St. Vincent and the Grenadines and percentage of married-couple family households in the United States with a correlation coefficient (R) of 0.133 and weighted average of 38.7%, a difference of 5.8%.
Married-couple Households Correlation Summary
| Measurement | African | Immigrants from St. Vincent and the Grenadines |
| Minimum | 12.5% | 17.7% |
| Maximum | 72.3% | 87.2% |
| Range | 59.8% | 69.5% |
| Mean | 36.0% | 45.8% |
| Median | 36.7% | 43.5% |
| Interquartile 25% (IQ1) | 31.1% | 35.8% |
| Interquartile 75% (IQ3) | 39.9% | 54.5% |
| Interquartile Range (IQR) | 8.8% | 18.8% |
| Standard Deviation (Sample) | 10.3% | 14.4% |
| Standard Deviation (Population) | 10.2% | 14.3% |
Similar Demographics by Married-couple Households
Demographics Similar to Africans by Married-couple Households
In terms of married-couple households, the demographic groups most similar to Africans are Immigrants from Haiti (40.9%, a difference of 0.060%), Colville (41.0%, a difference of 0.090%), Jamaican (40.9%, a difference of 0.14%), Trinidadian and Tobagonian (40.9%, a difference of 0.22%), and Immigrants from Caribbean (40.8%, a difference of 0.40%).
| Demographics | Rating | Rank | Married-couple Households |
| Sioux | 0.0 /100 | #305 | Tragic 41.5% |
| Guyanese | 0.0 /100 | #306 | Tragic 41.4% |
| Immigrants | Western Africa | 0.0 /100 | #307 | Tragic 41.4% |
| Crow | 0.0 /100 | #308 | Tragic 41.4% |
| Immigrants | Trinidad and Tobago | 0.0 /100 | #309 | Tragic 41.2% |
| Haitians | 0.0 /100 | #310 | Tragic 41.2% |
| Colville | 0.0 /100 | #311 | Tragic 41.0% |
| Africans | 0.0 /100 | #312 | Tragic 40.9% |
| Immigrants | Haiti | 0.0 /100 | #313 | Tragic 40.9% |
| Jamaicans | 0.0 /100 | #314 | Tragic 40.9% |
| Trinidadians and Tobagonians | 0.0 /100 | #315 | Tragic 40.9% |
| Immigrants | Caribbean | 0.0 /100 | #316 | Tragic 40.8% |
| Immigrants | Jamaica | 0.0 /100 | #317 | Tragic 40.7% |
| Liberians | 0.0 /100 | #318 | Tragic 40.7% |
| Bahamians | 0.0 /100 | #319 | Tragic 40.5% |
Demographics Similar to Immigrants from St. Vincent and the Grenadines by Married-couple Households
In terms of married-couple households, the demographic groups most similar to Immigrants from St. Vincent and the Grenadines are Senegalese (38.6%, a difference of 0.33%), Black/African American (38.5%, a difference of 0.51%), Immigrants from Somalia (38.4%, a difference of 0.66%), Immigrants from West Indies (39.0%, a difference of 0.78%), and Somali (39.0%, a difference of 0.81%).
| Demographics | Rating | Rank | Married-couple Households |
| Lumbee | 0.0 /100 | #327 | Tragic 39.6% |
| Barbadians | 0.0 /100 | #328 | Tragic 39.4% |
| Immigrants | Dominica | 0.0 /100 | #329 | Tragic 39.4% |
| Immigrants | Barbados | 0.0 /100 | #330 | Tragic 39.2% |
| Immigrants | Congo | 0.0 /100 | #331 | Tragic 39.0% |
| Somalis | 0.0 /100 | #332 | Tragic 39.0% |
| Immigrants | West Indies | 0.0 /100 | #333 | Tragic 39.0% |
| Immigrants | St. Vincent and the Grenadines | 0.0 /100 | #334 | Tragic 38.7% |
| Senegalese | 0.0 /100 | #335 | Tragic 38.6% |
| Blacks/African Americans | 0.0 /100 | #336 | Tragic 38.5% |
| Immigrants | Somalia | 0.0 /100 | #337 | Tragic 38.4% |
| Immigrants | Senegal | 0.0 /100 | #338 | Tragic 38.4% |
| British West Indians | 0.0 /100 | #339 | Tragic 38.3% |
| Dominicans | 0.0 /100 | #340 | Tragic 38.2% |
| Cape Verdeans | 0.0 /100 | #341 | Tragic 38.1% |