Croatian vs Slovene Average Family Size
COMPARE
Croatian
Slovene
Average Family Size
Average Family Size Comparison
Croatians
Slovenes
3.10
AVERAGE FAMILY SIZE
0.0/ 100
METRIC RATING
339th/ 347
METRIC RANK
3.07
AVERAGE FAMILY SIZE
0.0/ 100
METRIC RATING
345th/ 347
METRIC RANK
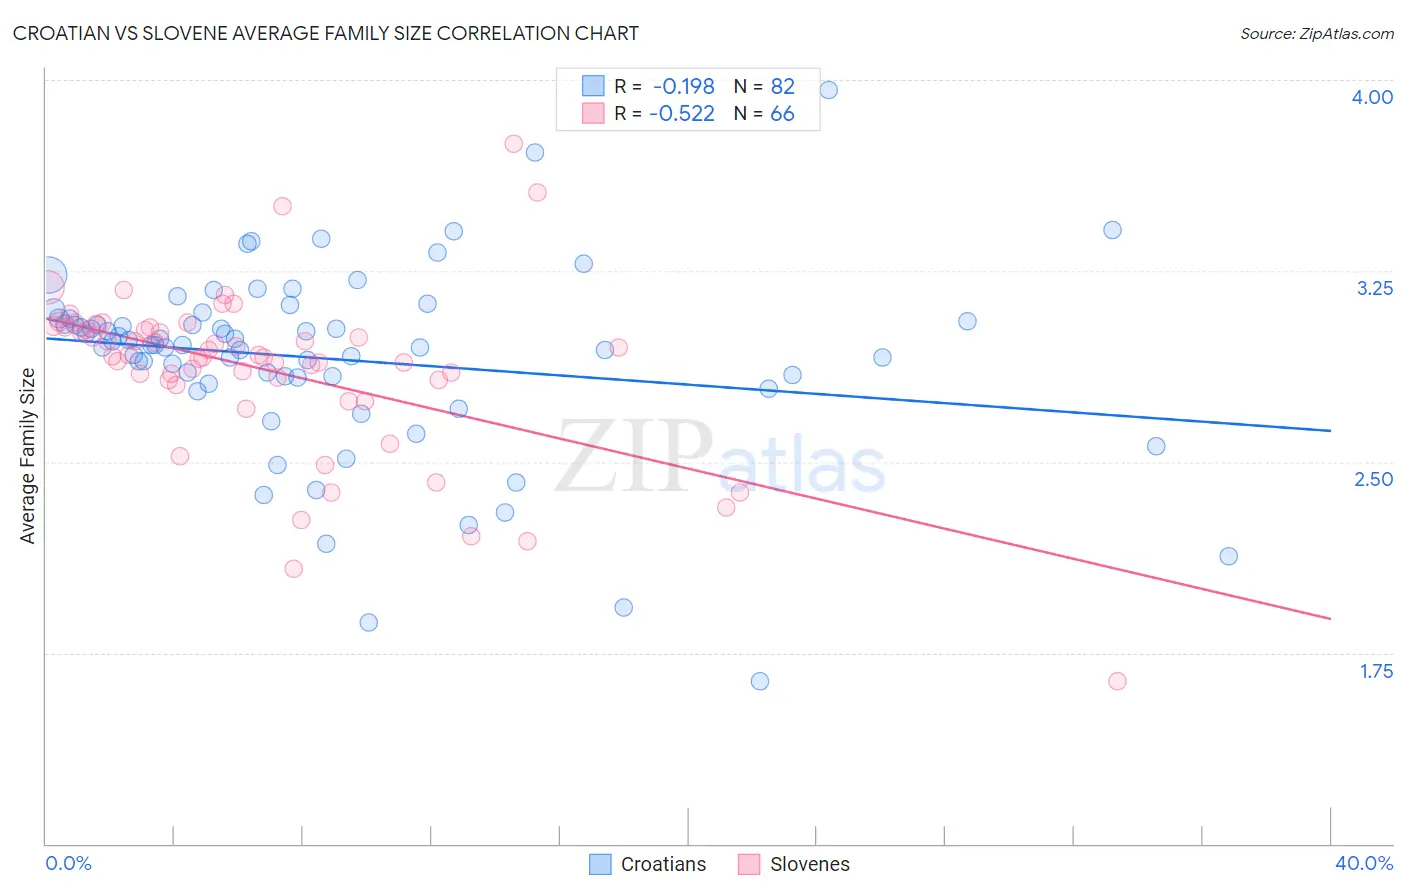
Croatian vs Slovene Average Family Size Correlation Chart
The statistical analysis conducted on geographies consisting of 375,543,133 people shows a poor negative correlation between the proportion of Croatians and average family size in the United States with a correlation coefficient (R) of -0.198 and weighted average of 3.10. Similarly, the statistical analysis conducted on geographies consisting of 261,257,003 people shows a substantial negative correlation between the proportion of Slovenes and average family size in the United States with a correlation coefficient (R) of -0.522 and weighted average of 3.07, a difference of 0.84%.
Average Family Size Correlation Summary
| Measurement | Croatian | Slovene |
| Minimum | 1.64 | 1.64 |
| Maximum | 3.96 | 3.75 |
| Range | 2.32 | 2.11 |
| Mean | 2.90 | 2.86 |
| Median | 2.96 | 2.92 |
| Interquartile 25% (IQ1) | 2.83 | 2.82 |
| Interquartile 75% (IQ3) | 3.06 | 3.03 |
| Interquartile Range (IQR) | 0.23 | 0.21 |
| Standard Deviation (Sample) | 0.37 | 0.34 |
| Standard Deviation (Population) | 0.37 | 0.33 |
Demographics Similar to Croatians and Slovenes by Average Family Size
In terms of average family size, the demographic groups most similar to Croatians are French (3.10, a difference of 0.010%), Swedish (3.10, a difference of 0.030%), Irish (3.10, a difference of 0.070%), Luxembourger (3.10, a difference of 0.13%), and Finnish (3.09, a difference of 0.14%). Similarly, the demographic groups most similar to Slovenes are French Canadian (3.07, a difference of 0.040%), Norwegian (3.08, a difference of 0.28%), Slovak (3.06, a difference of 0.29%), Carpatho Rusyn (3.06, a difference of 0.35%), and German (3.09, a difference of 0.51%).
| Demographics | Rating | Rank | Average Family Size |
| Czechs | 0.0 /100 | #328 | Tragic 3.11 |
| Belgians | 0.0 /100 | #329 | Tragic 3.11 |
| Latvians | 0.0 /100 | #330 | Tragic 3.11 |
| Scotch-Irish | 0.0 /100 | #331 | Tragic 3.11 |
| Scottish | 0.0 /100 | #332 | Tragic 3.11 |
| Estonians | 0.0 /100 | #333 | Tragic 3.10 |
| Lithuanians | 0.0 /100 | #334 | Tragic 3.10 |
| Luxembourgers | 0.0 /100 | #335 | Tragic 3.10 |
| Irish | 0.0 /100 | #336 | Tragic 3.10 |
| Swedes | 0.0 /100 | #337 | Tragic 3.10 |
| French | 0.0 /100 | #338 | Tragic 3.10 |
| Croatians | 0.0 /100 | #339 | Tragic 3.10 |
| Finns | 0.0 /100 | #340 | Tragic 3.09 |
| Poles | 0.0 /100 | #341 | Tragic 3.09 |
| Germans | 0.0 /100 | #342 | Tragic 3.09 |
| Norwegians | 0.0 /100 | #343 | Tragic 3.08 |
| French Canadians | 0.0 /100 | #344 | Tragic 3.07 |
| Slovenes | 0.0 /100 | #345 | Tragic 3.07 |
| Slovaks | 0.0 /100 | #346 | Tragic 3.06 |
| Carpatho Rusyns | 0.0 /100 | #347 | Tragic 3.06 |