Nepalese vs Salvadoran 4 or more Vehicles in Household
COMPARE
Nepalese
Salvadoran
4 or more Vehicles in Household
4 or more Vehicles in Household Comparison
Nepalese
Salvadorans
8.7%
4 OR MORE VEHICLES IN HOUSEHOLD
100.0/ 100
METRIC RATING
18th/ 347
METRIC RANK
7.8%
4 OR MORE VEHICLES IN HOUSEHOLD
100.0/ 100
METRIC RATING
42nd/ 347
METRIC RANK
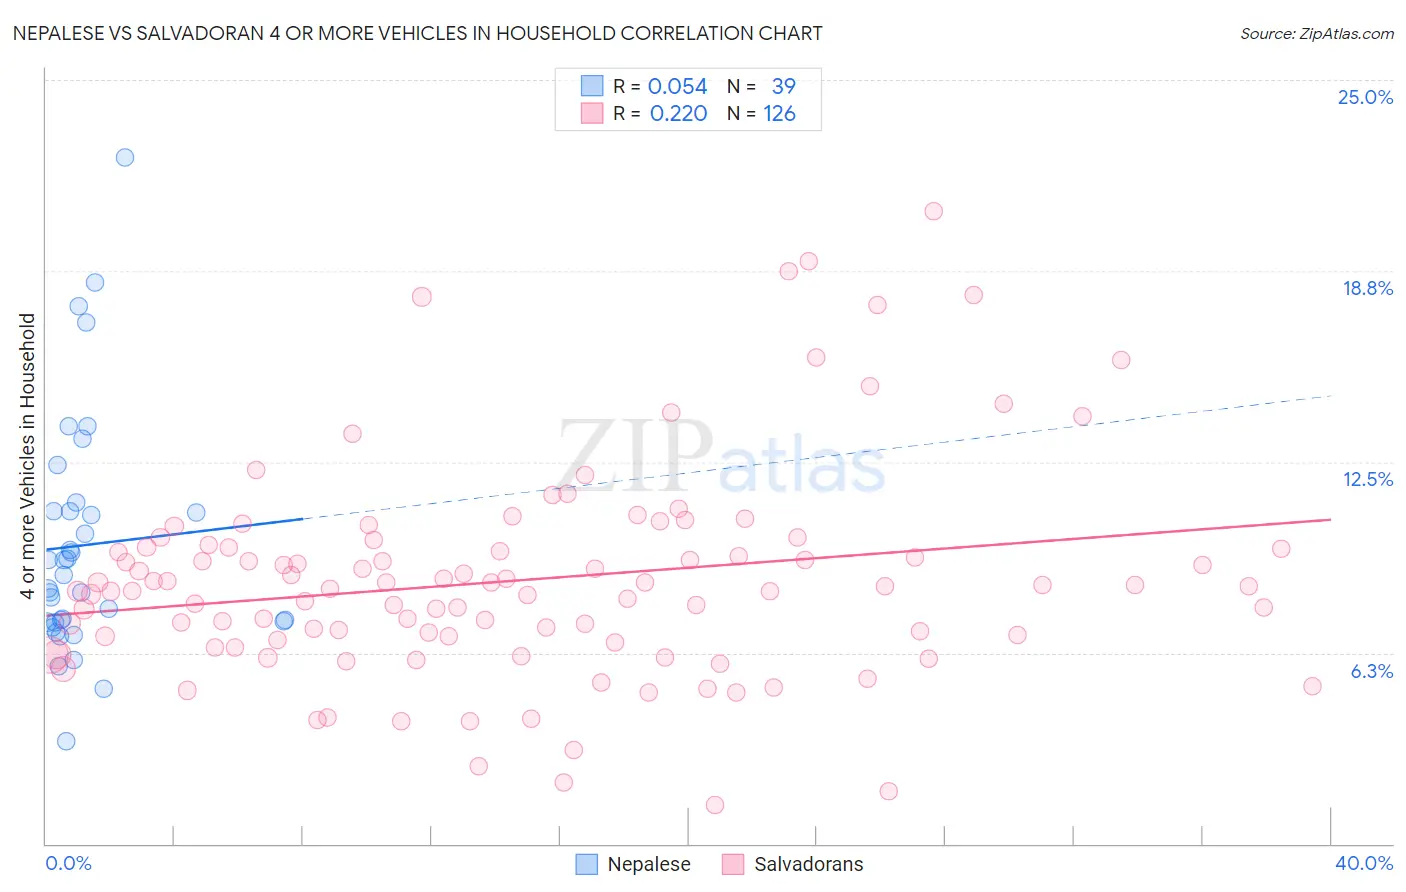
Nepalese vs Salvadoran 4 or more Vehicles in Household Correlation Chart
The statistical analysis conducted on geographies consisting of 24,517,800 people shows a slight positive correlation between the proportion of Nepalese and percentage of households with 4 or more vehicles available in the United States with a correlation coefficient (R) of 0.054 and weighted average of 8.7%. Similarly, the statistical analysis conducted on geographies consisting of 397,203,446 people shows a weak positive correlation between the proportion of Salvadorans and percentage of households with 4 or more vehicles available in the United States with a correlation coefficient (R) of 0.220 and weighted average of 7.8%, a difference of 11.7%.
4 or more Vehicles in Household Correlation Summary
| Measurement | Nepalese | Salvadoran |
| Minimum | 3.4% | 1.2% |
| Maximum | 22.4% | 20.7% |
| Range | 19.1% | 19.4% |
| Mean | 9.8% | 8.6% |
| Median | 8.8% | 8.4% |
| Interquartile 25% (IQ1) | 7.2% | 6.7% |
| Interquartile 75% (IQ3) | 10.9% | 9.7% |
| Interquartile Range (IQR) | 3.7% | 3.0% |
| Standard Deviation (Sample) | 3.9% | 3.5% |
| Standard Deviation (Population) | 3.9% | 3.5% |
Similar Demographics by 4 or more Vehicles in Household
Demographics Similar to Nepalese by 4 or more Vehicles in Household
In terms of 4 or more vehicles in household, the demographic groups most similar to Nepalese are Ute (8.8%, a difference of 0.10%), Lumbee (8.8%, a difference of 0.43%), Shoshone (8.8%, a difference of 1.1%), Korean (8.6%, a difference of 1.1%), and Chinese (8.8%, a difference of 1.2%).
| Demographics | Rating | Rank | 4 or more Vehicles in Household |
| Immigrants | Mexico | 100.0 /100 | #11 | Exceptional 9.0% |
| Mexicans | 100.0 /100 | #12 | Exceptional 8.9% |
| Hawaiians | 100.0 /100 | #13 | Exceptional 8.9% |
| Chinese | 100.0 /100 | #14 | Exceptional 8.8% |
| Shoshone | 100.0 /100 | #15 | Exceptional 8.8% |
| Lumbee | 100.0 /100 | #16 | Exceptional 8.8% |
| Ute | 100.0 /100 | #17 | Exceptional 8.8% |
| Nepalese | 100.0 /100 | #18 | Exceptional 8.7% |
| Koreans | 100.0 /100 | #19 | Exceptional 8.6% |
| Pueblo | 100.0 /100 | #20 | Exceptional 8.6% |
| Danes | 100.0 /100 | #21 | Exceptional 8.6% |
| Immigrants | Vietnam | 100.0 /100 | #22 | Exceptional 8.6% |
| Immigrants | Philippines | 100.0 /100 | #23 | Exceptional 8.5% |
| Immigrants | Central America | 100.0 /100 | #24 | Exceptional 8.5% |
| Basques | 100.0 /100 | #25 | Exceptional 8.4% |
Demographics Similar to Salvadorans by 4 or more Vehicles in Household
In terms of 4 or more vehicles in household, the demographic groups most similar to Salvadorans are Fijian (7.8%, a difference of 0.11%), Bhutanese (7.8%, a difference of 0.38%), Choctaw (7.8%, a difference of 0.43%), Pima (7.9%, a difference of 0.49%), and Crow (7.8%, a difference of 0.60%).
| Demographics | Rating | Rank | 4 or more Vehicles in Household |
| Guamanians/Chamorros | 100.0 /100 | #35 | Exceptional 8.1% |
| Norwegians | 100.0 /100 | #36 | Exceptional 8.0% |
| Scandinavians | 100.0 /100 | #37 | Exceptional 8.0% |
| Sioux | 100.0 /100 | #38 | Exceptional 8.0% |
| Spanish Americans | 100.0 /100 | #39 | Exceptional 8.0% |
| Spanish | 100.0 /100 | #40 | Exceptional 7.9% |
| Pima | 100.0 /100 | #41 | Exceptional 7.9% |
| Salvadorans | 100.0 /100 | #42 | Exceptional 7.8% |
| Fijians | 100.0 /100 | #43 | Exceptional 7.8% |
| Bhutanese | 100.0 /100 | #44 | Exceptional 7.8% |
| Choctaw | 100.0 /100 | #45 | Exceptional 7.8% |
| Crow | 100.0 /100 | #46 | Exceptional 7.8% |
| Osage | 100.0 /100 | #47 | Exceptional 7.8% |
| Swiss | 100.0 /100 | #48 | Exceptional 7.8% |
| Cherokee | 100.0 /100 | #49 | Exceptional 7.7% |