Nepalese vs New Zealander Divorced or Separated
COMPARE
Nepalese
New Zealander
Divorced or Separated
Divorced or Separated Comparison
Nepalese
New Zealanders
12.5%
DIVORCED OR SEPARATED
1.8/ 100
METRIC RATING
248th/ 347
METRIC RANK
11.9%
DIVORCED OR SEPARATED
87.5/ 100
METRIC RATING
133rd/ 347
METRIC RANK
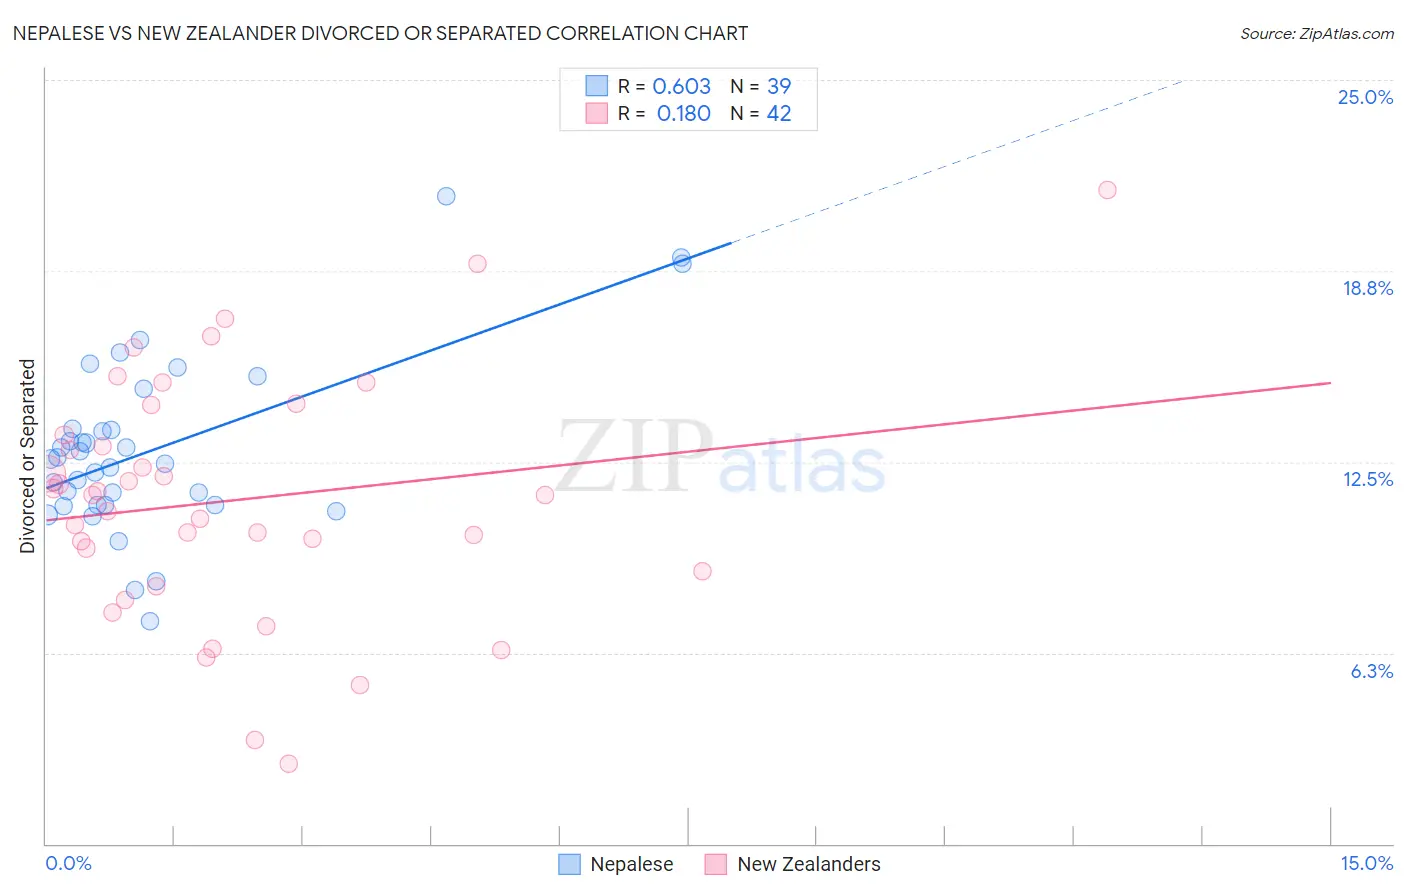
Nepalese vs New Zealander Divorced or Separated Correlation Chart
The statistical analysis conducted on geographies consisting of 24,519,269 people shows a significant positive correlation between the proportion of Nepalese and percentage of population currently divorced or separated in the United States with a correlation coefficient (R) of 0.603 and weighted average of 12.5%. Similarly, the statistical analysis conducted on geographies consisting of 106,899,589 people shows a poor positive correlation between the proportion of New Zealanders and percentage of population currently divorced or separated in the United States with a correlation coefficient (R) of 0.180 and weighted average of 11.9%, a difference of 5.2%.
Divorced or Separated Correlation Summary
| Measurement | Nepalese | New Zealander |
| Minimum | 7.3% | 2.6% |
| Maximum | 21.2% | 21.4% |
| Range | 13.9% | 18.8% |
| Mean | 12.9% | 11.2% |
| Median | 12.6% | 11.4% |
| Interquartile 25% (IQ1) | 11.1% | 8.9% |
| Interquartile 75% (IQ3) | 13.6% | 13.4% |
| Interquartile Range (IQR) | 2.5% | 4.5% |
| Standard Deviation (Sample) | 2.9% | 4.0% |
| Standard Deviation (Population) | 2.8% | 3.9% |
Similar Demographics by Divorced or Separated
Demographics Similar to Nepalese by Divorced or Separated
In terms of divorced or separated, the demographic groups most similar to Nepalese are Finnish (12.5%, a difference of 0.010%), German (12.5%, a difference of 0.020%), Immigrants from West Indies (12.5%, a difference of 0.060%), Hispanic or Latino (12.5%, a difference of 0.080%), and Irish (12.5%, a difference of 0.29%).
| Demographics | Rating | Rank | Divorced or Separated |
| Uruguayans | 3.4 /100 | #241 | Tragic 12.4% |
| Dutch | 3.1 /100 | #242 | Tragic 12.4% |
| Immigrants | Latin America | 2.8 /100 | #243 | Tragic 12.4% |
| Alaska Natives | 2.5 /100 | #244 | Tragic 12.4% |
| Hispanics or Latinos | 2.0 /100 | #245 | Tragic 12.5% |
| Immigrants | West Indies | 1.9 /100 | #246 | Tragic 12.5% |
| Germans | 1.8 /100 | #247 | Tragic 12.5% |
| Nepalese | 1.8 /100 | #248 | Tragic 12.5% |
| Finns | 1.8 /100 | #249 | Tragic 12.5% |
| Irish | 1.3 /100 | #250 | Tragic 12.5% |
| Aleuts | 1.3 /100 | #251 | Tragic 12.5% |
| Liberians | 0.9 /100 | #252 | Tragic 12.6% |
| Somalis | 0.9 /100 | #253 | Tragic 12.6% |
| Senegalese | 0.8 /100 | #254 | Tragic 12.6% |
| Welsh | 0.7 /100 | #255 | Tragic 12.6% |
Demographics Similar to New Zealanders by Divorced or Separated
In terms of divorced or separated, the demographic groups most similar to New Zealanders are Immigrants from Afghanistan (11.8%, a difference of 0.030%), Immigrants from Austria (11.8%, a difference of 0.060%), Immigrants from Cambodia (11.8%, a difference of 0.060%), Immigrants from St. Vincent and the Grenadines (11.8%, a difference of 0.070%), and Immigrants from Ecuador (11.8%, a difference of 0.11%).
| Demographics | Rating | Rank | Divorced or Separated |
| South American Indians | 92.1 /100 | #126 | Exceptional 11.8% |
| South Africans | 88.9 /100 | #127 | Excellent 11.8% |
| Immigrants | Ecuador | 88.9 /100 | #128 | Excellent 11.8% |
| Immigrants | St. Vincent and the Grenadines | 88.4 /100 | #129 | Excellent 11.8% |
| Immigrants | Austria | 88.2 /100 | #130 | Excellent 11.8% |
| Immigrants | Cambodia | 88.2 /100 | #131 | Excellent 11.8% |
| Immigrants | Afghanistan | 87.9 /100 | #132 | Excellent 11.8% |
| New Zealanders | 87.5 /100 | #133 | Excellent 11.9% |
| Argentineans | 85.1 /100 | #134 | Excellent 11.9% |
| Danes | 84.8 /100 | #135 | Excellent 11.9% |
| Carpatho Rusyns | 84.8 /100 | #136 | Excellent 11.9% |
| Alsatians | 84.0 /100 | #137 | Excellent 11.9% |
| Immigrants | Netherlands | 83.9 /100 | #138 | Excellent 11.9% |
| Australians | 83.6 /100 | #139 | Excellent 11.9% |
| Lebanese | 83.4 /100 | #140 | Excellent 11.9% |